Immigrants from Peru vs Osage In Labor Force | Age 30-34

COMPARE

Immigrants from Peru
Race
Ancestry
AfghanAfricanAlaska NativeAlaskan AthabascanAlbanianAleutAlsatianAmericanApacheArabArapahoArgentineanArmenianAssyrian/Chaldean/SyriacAustralianAustrianBahamianBangladeshiBarbadianBasqueBelgianBelizeanBermudanBhutaneseBlackfeetBolivianBrazilianBritishBritish West IndianBulgarianBurmeseCajunCambodianCanadianCape VerdeanCarpatho RusynCelticCentral AmericanCentral American IndianCherokeeCheyenneChickasawChileanChineseChippewaChoctawColombianColvilleComancheCosta RicanCreeCreekCroatianCrowCubanCypriotCzechCzechoslovakianDanishDelawareDominicanDutchDutch West IndianEastern EuropeanEcuadorianEgyptianEnglishEstonianEthiopianEuropeanFijianFilipinoFinnishFrenchFrench American IndianFrench CanadianGermanGerman RussianGhanaianGreekGuamanian/ChamorroGuatemalanGuyaneseHaitianHmongHonduranHopiHoumaHungarianIcelanderIndian (Asian)IndonesianInupiatIranianIraqiIrishIroquoisIsraeliItalianJamaicanJapaneseJordanianKenyanKiowaKoreanLaotianLatvianLebaneseLiberianLithuanianLumbeeLuxembourgerMacedonianMalaysianMalteseMarshalleseMenomineeMexicanMexican American IndianMongolianMoroccanNative HawaiianNavajoNepaleseNew ZealanderNicaraguanNigerianNorthern EuropeanNorwegianOkinawanOttawaPaiutePakistaniPalestinianPanamanianParaguayanPennsylvania GermanPeruvianPimaPolishPortuguesePotawatomiPuebloPuerto RicanPuget Sound SalishRomanianRussianSalvadoranSamoanScandinavianScotch-IrishScottishSeminoleSenegaleseSerbianShoshoneSierra LeoneanSiouxSlavicSlovakSloveneSomaliSouth AfricanSouth AmericanSouth American IndianSoviet UnionSpaniardSpanishSpanish AmericanSpanish American IndianSri LankanSubsaharan AfricanSudaneseSwedishSwissSyrianTaiwaneseThaiTlingit-HaidaTohono O'OdhamTonganTrinidadian and TobagonianTsimshianTurkishU.S. Virgin IslanderUgandanUkrainianUruguayanUteVenezuelanVietnameseWelshWest IndianYakamaYaquiYugoslavianYumanYup'ikZimbabwean
Immigration
NonimmigrantsImmigrantsAfghanistanAfricaAlbaniaArgentinaArmeniaAsiaAustraliaAustriaBahamasBangladeshBarbadosBelarusBelgiumBelizeBoliviaBosnia and HerzegovinaBrazilBulgariaBurma/MyanmarCabo VerdeCambodiaCameroonCanadaCaribbeanCentral AmericaChileChinaColombiaCongoCosta RicaCroatiaCubaCzechoslovakiaDenmarkDominicaDominican RepublicEastern AfricaEastern AsiaEastern EuropeEcuadorEgyptEl SalvadorEnglandEritreaEthiopiaEuropeFijiFranceGermanyGhanaGreeceGrenadaGuatemalaGuyanaHaitiHondurasHong KongHungaryIndiaIndonesiaIranIraqIrelandIsraelItalyJamaicaJapanJordanKazakhstanKenyaKoreaKuwaitLaosLatin AmericaLatviaLebanonLiberiaLithuaniaMalaysiaMexicoMicronesiaMiddle AfricaMoldovaMoroccoNepalNetherlandsNicaraguaNigeriaNorth AmericaNorth MacedoniaNorthern AfricaNorthern EuropeNorwayOceaniaPakistanPanamaPeruPhilippinesPolandPortugalRomaniaRussiaSaudi ArabiaScotlandSenegalSerbiaSierra LeoneSingaporeSomaliaSouth AfricaSouth AmericaSouth Central AsiaSouth Eastern AsiaSouthern EuropeSpainSri LankaSt. Vincent and the GrenadinesSudanSwedenSwitzerlandSyriaTaiwanThailandTrinidad and TobagoTurkeyUgandaUkraineUruguayUzbekistanVenezuelaVietnamWest IndiesWestern AfricaWestern AsiaWestern EuropeYemenZaireZimbabweAzores
Osage
Race
Ancestry
AfghanAfricanAlaska NativeAlaskan AthabascanAlbanianAleutAlsatianAmericanApacheArabArapahoArgentineanArmenianAssyrian/Chaldean/SyriacAustralianAustrianBahamianBangladeshiBarbadianBasqueBelgianBelizeanBermudanBhutaneseBlackfeetBolivianBrazilianBritishBritish West IndianBulgarianBurmeseCajunCambodianCanadianCape VerdeanCarpatho RusynCelticCentral AmericanCentral American IndianCherokeeCheyenneChickasawChileanChineseChippewaChoctawColombianColvilleComancheCosta RicanCreeCreekCroatianCrowCubanCypriotCzechCzechoslovakianDanishDelawareDominicanDutchDutch West IndianEastern EuropeanEcuadorianEgyptianEnglishEstonianEthiopianEuropeanFijianFilipinoFinnishFrenchFrench American IndianFrench CanadianGermanGerman RussianGhanaianGreekGuamanian/ChamorroGuatemalanGuyaneseHaitianHmongHonduranHopiHoumaHungarianIcelanderIndian (Asian)IndonesianInupiatIranianIraqiIrishIroquoisIsraeliItalianJamaicanJapaneseJordanianKenyanKiowaKoreanLaotianLatvianLebaneseLiberianLithuanianLumbeeLuxembourgerMacedonianMalaysianMalteseMarshalleseMenomineeMexicanMexican American IndianMongolianMoroccanNative HawaiianNavajoNepaleseNew ZealanderNicaraguanNigerianNorthern EuropeanNorwegianOkinawanOsageOttawaPaiutePakistaniPalestinianPanamanianParaguayanPennsylvania GermanPeruvianPimaPolishPortuguesePotawatomiPuebloPuerto RicanPuget Sound SalishRomanianRussianSalvadoranSamoanScandinavianScotch-IrishScottishSeminoleSenegaleseSerbianShoshoneSierra LeoneanSiouxSlavicSlovakSloveneSomaliSouth AfricanSouth AmericanSouth American IndianSoviet UnionSpaniardSpanishSpanish AmericanSpanish American IndianSri LankanSubsaharan AfricanSudaneseSwedishSwissSyrianTaiwaneseThaiTlingit-HaidaTohono O'OdhamTonganTrinidadian and TobagonianTsimshianTurkishU.S. Virgin IslanderUgandanUkrainianUruguayanUteVenezuelanVietnameseWelshWest IndianYakamaYaquiYugoslavianYumanYup'ikZimbabwean
Immigration
NonimmigrantsImmigrantsAfghanistanAfricaAlbaniaArgentinaArmeniaAsiaAustraliaAustriaBahamasBangladeshBarbadosBelarusBelgiumBelizeBoliviaBosnia and HerzegovinaBrazilBulgariaBurma/MyanmarCabo VerdeCambodiaCameroonCanadaCaribbeanCentral AmericaChileChinaColombiaCongoCosta RicaCroatiaCubaCzechoslovakiaDenmarkDominicaDominican RepublicEastern AfricaEastern AsiaEastern EuropeEcuadorEgyptEl SalvadorEnglandEritreaEthiopiaEuropeFijiFranceGermanyGhanaGreeceGrenadaGuatemalaGuyanaHaitiHondurasHong KongHungaryIndiaIndonesiaIranIraqIrelandIsraelItalyJamaicaJapanJordanKazakhstanKenyaKoreaKuwaitLaosLatin AmericaLatviaLebanonLiberiaLithuaniaMalaysiaMexicoMicronesiaMiddle AfricaMoldovaMoroccoNepalNetherlandsNicaraguaNigeriaNorth AmericaNorth MacedoniaNorthern AfricaNorthern EuropeNorwayOceaniaPakistanPanamaPhilippinesPolandPortugalRomaniaRussiaSaudi ArabiaScotlandSenegalSerbiaSierra LeoneSingaporeSomaliaSouth AfricaSouth AmericaSouth Central AsiaSouth Eastern AsiaSouthern EuropeSpainSri LankaSt. Vincent and the GrenadinesSudanSwedenSwitzerlandSyriaTaiwanThailandTrinidad and TobagoTurkeyUgandaUkraineUruguayUzbekistanVenezuelaVietnamWest IndiesWestern AfricaWestern AsiaWestern EuropeYemenZaireZimbabweAzores
In Labor Force | Age 30-34
Income
Poverty
Unemployment
Labor Participation
Family Structure
Vehicle Availability
Education Level
Disability

In Labor Force | Age 30-34 Comparison

Immigrants from Peru

Osage

Average
Tragic
84.7%
IN LABOR FORCE | AGE 30-34
52.4/ 100
METRIC RATING
168th/ 347
METRIC RANK
82.3%
IN LABOR FORCE | AGE 30-34
0.0/ 100
METRIC RATING
305th/ 347
METRIC RANK

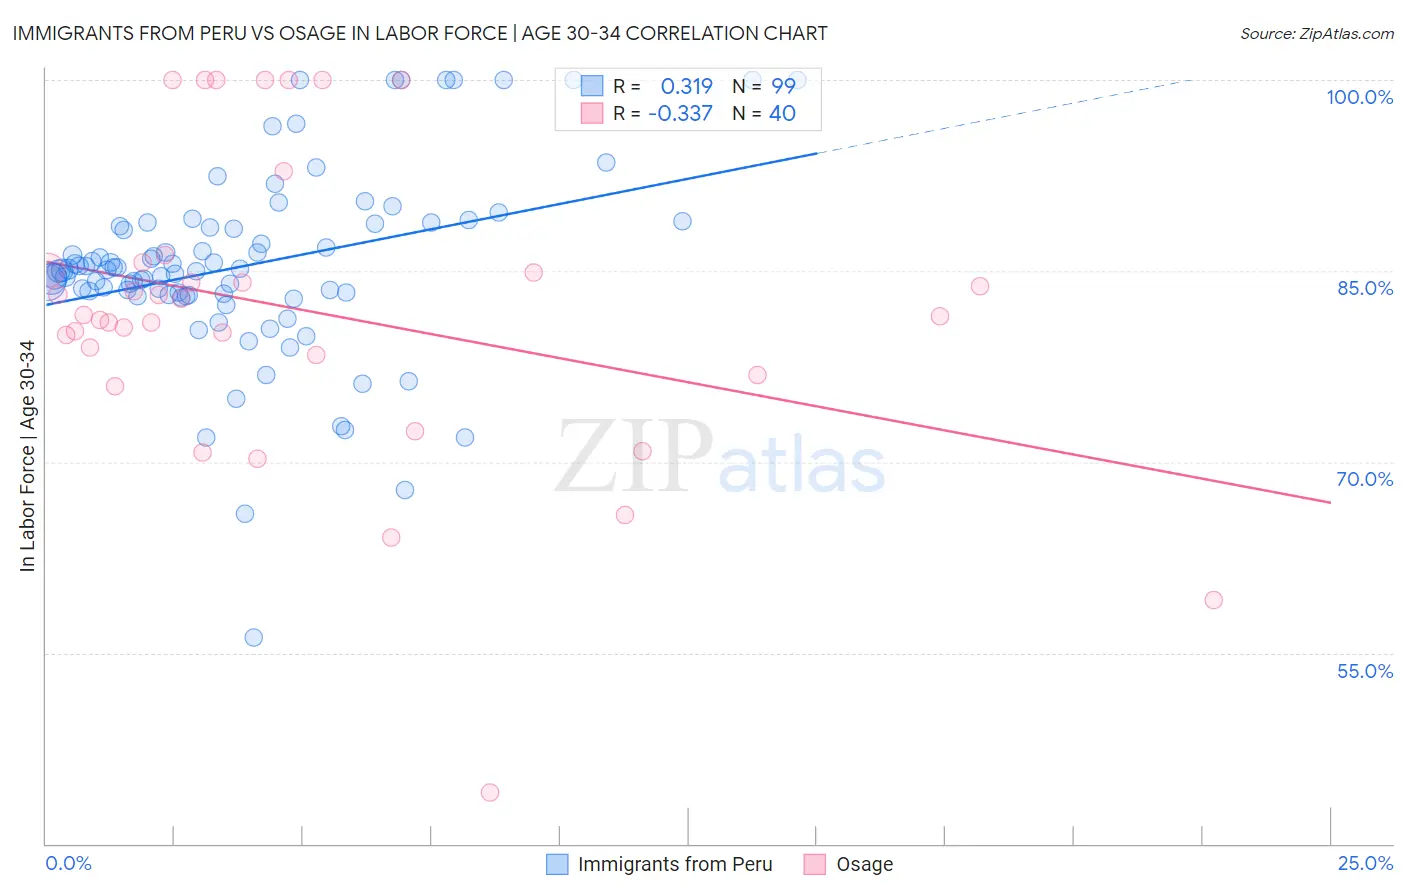
Immigrants from Peru vs Osage In Labor Force | Age 30-34 Correlation Chart

The statistical analysis conducted on geographies consisting of 328,740,513 people shows a mild positive correlation between the proportion of Immigrants from Peru and labor force participation rate among population between the ages 30 and 34 in the United States with a correlation coefficient (R) of 0.319 and weighted average of 84.7%. Similarly, the statistical analysis conducted on geographies consisting of 91,795,365 people shows a mild negative correlation between the proportion of Osage and labor force participation rate among population between the ages 30 and 34 in the United States with a correlation coefficient (R) of -0.337 and weighted average of 82.3%, a difference of 3.0%.
Immigrants from Peru vs Osage In Labor Force | Age 30-34

In Labor Force | Age 30-34 Correlation Summary

MeasurementImmigrants from PeruOsage
Minimum56.2%44.0%
Maximum100.0%100.0%
Range43.8%56.0%
Mean85.4%81.8%
Median85.1%81.5%
Interquartile 25% (IQ1)83.1%77.6%
Interquartile 75% (IQ3)88.7%85.4%
Interquartile Range (IQR)5.6%7.8%
Standard Deviation (Sample)7.5%12.0%
Standard Deviation (Population)7.4%11.8%

Similar Demographics by In Labor Force | Age 30-34

Demographics Similar to Immigrants from Peru by In Labor Force | Age 30-34

In terms of in labor force | age 30-34, the demographic groups most similar to Immigrants from Peru are South American Indian (84.7%, a difference of 0.0%), Immigrants from Burma/Myanmar (84.7%, a difference of 0.0%), Irish (84.7%, a difference of 0.0%), Immigrants from England (84.7%, a difference of 0.0%), and Immigrants from South Eastern Asia (84.7%, a difference of 0.010%).
DemographicsRating | RankIn Labor Force | Age 30-34
Immigrants | Cambodia
60.7
/100
|
#161
Good
84.7%
South Americans
58.7
/100
|
#162
Average
84.7%
Immigrants | Uruguay
57.4
/100
|
#163
Average
84.7%
Icelanders
56.8
/100
|
#164
Average
84.7%
Immigrants | Western Europe
56.7
/100
|
#165
Average
84.7%
Afghans
55.2
/100
|
#166
Average
84.7%
Immigrants | South Eastern Asia
54.2
/100
|
#167
Average
84.7%
Immigrants | Peru
52.4
/100
|
#168
Average
84.7%
South American Indians
52.1
/100
|
#169
Average
84.7%
Immigrants | Burma/Myanmar
52.0
/100
|
#170
Average
84.7%
Irish
52.0
/100
|
#171
Average
84.7%
Immigrants | England
51.7
/100
|
#172
Average
84.7%
Israelis
51.1
/100
|
#173
Average
84.7%
Finns
50.0
/100
|
#174
Average
84.7%
Immigrants | South America
50.0
/100
|
#175
Average
84.7%

Demographics Similar to Osage by In Labor Force | Age 30-34

In terms of in labor force | age 30-34, the demographic groups most similar to Osage are Spanish American Indian (82.2%, a difference of 0.020%), Menominee (82.2%, a difference of 0.070%), Tlingit-Haida (82.3%, a difference of 0.080%), Immigrants from Micronesia (82.4%, a difference of 0.16%), and Ottawa (82.4%, a difference of 0.17%).
DemographicsRating | RankIn Labor Force | Age 30-34
Aleuts
0.0
/100
|
#298
Tragic
82.6%
Immigrants | Central America
0.0
/100
|
#299
Tragic
82.5%
Hmong
0.0
/100
|
#300
Tragic
82.4%
Hispanics or Latinos
0.0
/100
|
#301
Tragic
82.4%
Ottawa
0.0
/100
|
#302
Tragic
82.4%
Immigrants | Micronesia
0.0
/100
|
#303
Tragic
82.4%
Tlingit-Haida
0.0
/100
|
#304
Tragic
82.3%
Osage
0.0
/100
|
#305
Tragic
82.3%
Spanish American Indians
0.0
/100
|
#306
Tragic
82.2%
Menominee
0.0
/100
|
#307
Tragic
82.2%
Puget Sound Salish
0.0
/100
|
#308
Tragic
82.1%
Immigrants | Mexico
0.0
/100
|
#309
Tragic
82.0%
Cajuns
0.0
/100
|
#310
Tragic
82.0%
Chickasaw
0.0
/100
|
#311
Tragic
81.9%
Mexicans
0.0
/100
|
#312
Tragic
81.9%