Immigrants from Pakistan vs Potawatomi In Labor Force | Age > 16
COMPARE
Immigrants from Pakistan
Potawatomi
In Labor Force | Age > 16
In Labor Force | Age > 16 Comparison
Immigrants from Pakistan
Potawatomi
66.7%
IN LABOR FORCE | AGE > 16
100.0/ 100
METRIC RATING
44th/ 347
METRIC RANK
62.8%
IN LABOR FORCE | AGE > 16
0.0/ 100
METRIC RATING
315th/ 347
METRIC RANK
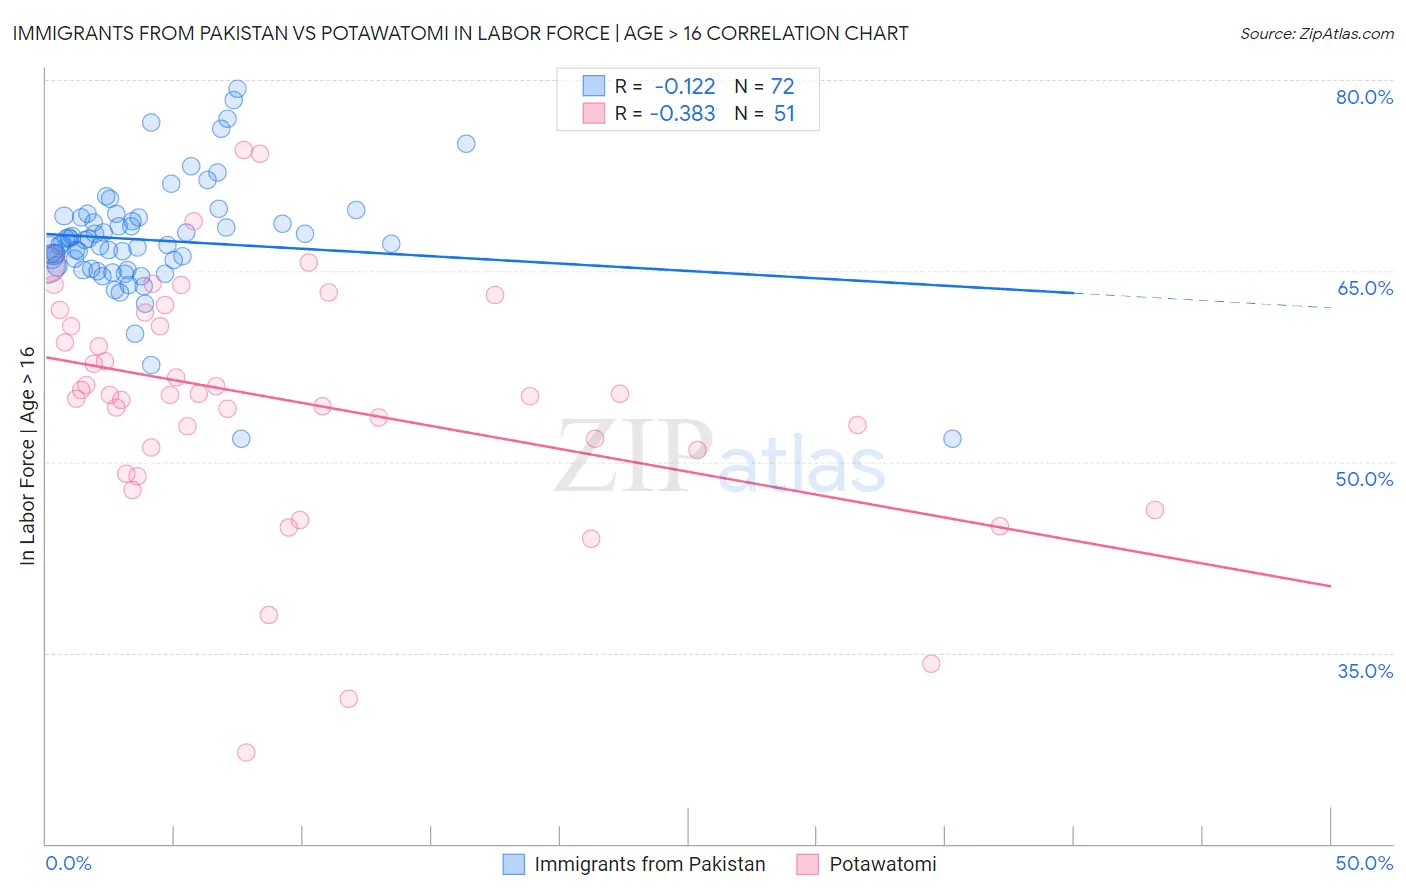
Immigrants from Pakistan vs Potawatomi In Labor Force | Age > 16 Correlation Chart
The statistical analysis conducted on geographies consisting of 283,909,562 people shows a poor negative correlation between the proportion of Immigrants from Pakistan and labor force participation rate among population ages 16 and over in the United States with a correlation coefficient (R) of -0.122 and weighted average of 66.7%. Similarly, the statistical analysis conducted on geographies consisting of 117,774,216 people shows a mild negative correlation between the proportion of Potawatomi and labor force participation rate among population ages 16 and over in the United States with a correlation coefficient (R) of -0.383 and weighted average of 62.8%, a difference of 6.2%.
In Labor Force | Age > 16 Correlation Summary
| Measurement | Immigrants from Pakistan | Potawatomi |
| Minimum | 51.8% | 27.1% |
| Maximum | 79.3% | 74.5% |
| Range | 27.5% | 47.4% |
| Mean | 67.4% | 54.8% |
| Median | 67.1% | 55.3% |
| Interquartile 25% (IQ1) | 65.3% | 50.9% |
| Interquartile 75% (IQ3) | 69.2% | 61.7% |
| Interquartile Range (IQR) | 3.9% | 10.8% |
| Standard Deviation (Sample) | 4.7% | 9.5% |
| Standard Deviation (Population) | 4.6% | 9.4% |
Similar Demographics by In Labor Force | Age > 16
Demographics Similar to Immigrants from Pakistan by In Labor Force | Age > 16
In terms of in labor force | age > 16, the demographic groups most similar to Immigrants from Pakistan are Luxembourger (66.7%, a difference of 0.050%), Immigrants from Brazil (66.7%, a difference of 0.050%), Senegalese (66.7%, a difference of 0.070%), Brazilian (66.6%, a difference of 0.12%), and Immigrants from Bulgaria (66.6%, a difference of 0.12%).
| Demographics | Rating | Rank | In Labor Force | Age > 16 |
| Immigrants | Afghanistan | 100.0 /100 | #37 | Exceptional 67.0% |
| Immigrants | Nigeria | 100.0 /100 | #38 | Exceptional 66.9% |
| Salvadorans | 100.0 /100 | #39 | Exceptional 66.8% |
| Immigrants | El Salvador | 100.0 /100 | #40 | Exceptional 66.8% |
| Immigrants | Zimbabwe | 100.0 /100 | #41 | Exceptional 66.8% |
| Senegalese | 100.0 /100 | #42 | Exceptional 66.7% |
| Luxembourgers | 100.0 /100 | #43 | Exceptional 66.7% |
| Immigrants | Pakistan | 100.0 /100 | #44 | Exceptional 66.7% |
| Immigrants | Brazil | 100.0 /100 | #45 | Exceptional 66.7% |
| Brazilians | 100.0 /100 | #46 | Exceptional 66.6% |
| Immigrants | Bulgaria | 100.0 /100 | #47 | Exceptional 66.6% |
| Nigerians | 100.0 /100 | #48 | Exceptional 66.6% |
| Immigrants | Northern Africa | 100.0 /100 | #49 | Exceptional 66.6% |
| Cape Verdeans | 100.0 /100 | #50 | Exceptional 66.6% |
| Immigrants | Kuwait | 100.0 /100 | #51 | Exceptional 66.5% |
Demographics Similar to Potawatomi by In Labor Force | Age > 16
In terms of in labor force | age > 16, the demographic groups most similar to Potawatomi are Yup'ik (62.7%, a difference of 0.22%), Yaqui (63.0%, a difference of 0.35%), Chippewa (63.1%, a difference of 0.44%), Iroquois (63.2%, a difference of 0.57%), and Blackfeet (63.2%, a difference of 0.64%).
| Demographics | Rating | Rank | In Labor Force | Age > 16 |
| Pennsylvania Germans | 0.0 /100 | #308 | Tragic 63.4% |
| Scotch-Irish | 0.0 /100 | #309 | Tragic 63.3% |
| Shoshone | 0.0 /100 | #310 | Tragic 63.2% |
| Blackfeet | 0.0 /100 | #311 | Tragic 63.2% |
| Iroquois | 0.0 /100 | #312 | Tragic 63.2% |
| Chippewa | 0.0 /100 | #313 | Tragic 63.1% |
| Yaqui | 0.0 /100 | #314 | Tragic 63.0% |
| Potawatomi | 0.0 /100 | #315 | Tragic 62.8% |
| Yup'ik | 0.0 /100 | #316 | Tragic 62.7% |
| Kiowa | 0.0 /100 | #317 | Tragic 62.4% |
| Chickasaw | 0.0 /100 | #318 | Tragic 62.3% |
| Arapaho | 0.0 /100 | #319 | Tragic 62.1% |
| Yakama | 0.0 /100 | #320 | Tragic 62.1% |
| Americans | 0.0 /100 | #321 | Tragic 62.1% |
| Ottawa | 0.0 /100 | #322 | Tragic 62.0% |