Immigrants from Pakistan vs Egyptian In Labor Force | Age > 16
COMPARE
Immigrants from Pakistan
Egyptian
In Labor Force | Age > 16
In Labor Force | Age > 16 Comparison
Immigrants from Pakistan
Egyptians
66.7%
IN LABOR FORCE | AGE > 16
100.0/ 100
METRIC RATING
44th/ 347
METRIC RANK
66.2%
IN LABOR FORCE | AGE > 16
99.8/ 100
METRIC RATING
67th/ 347
METRIC RANK
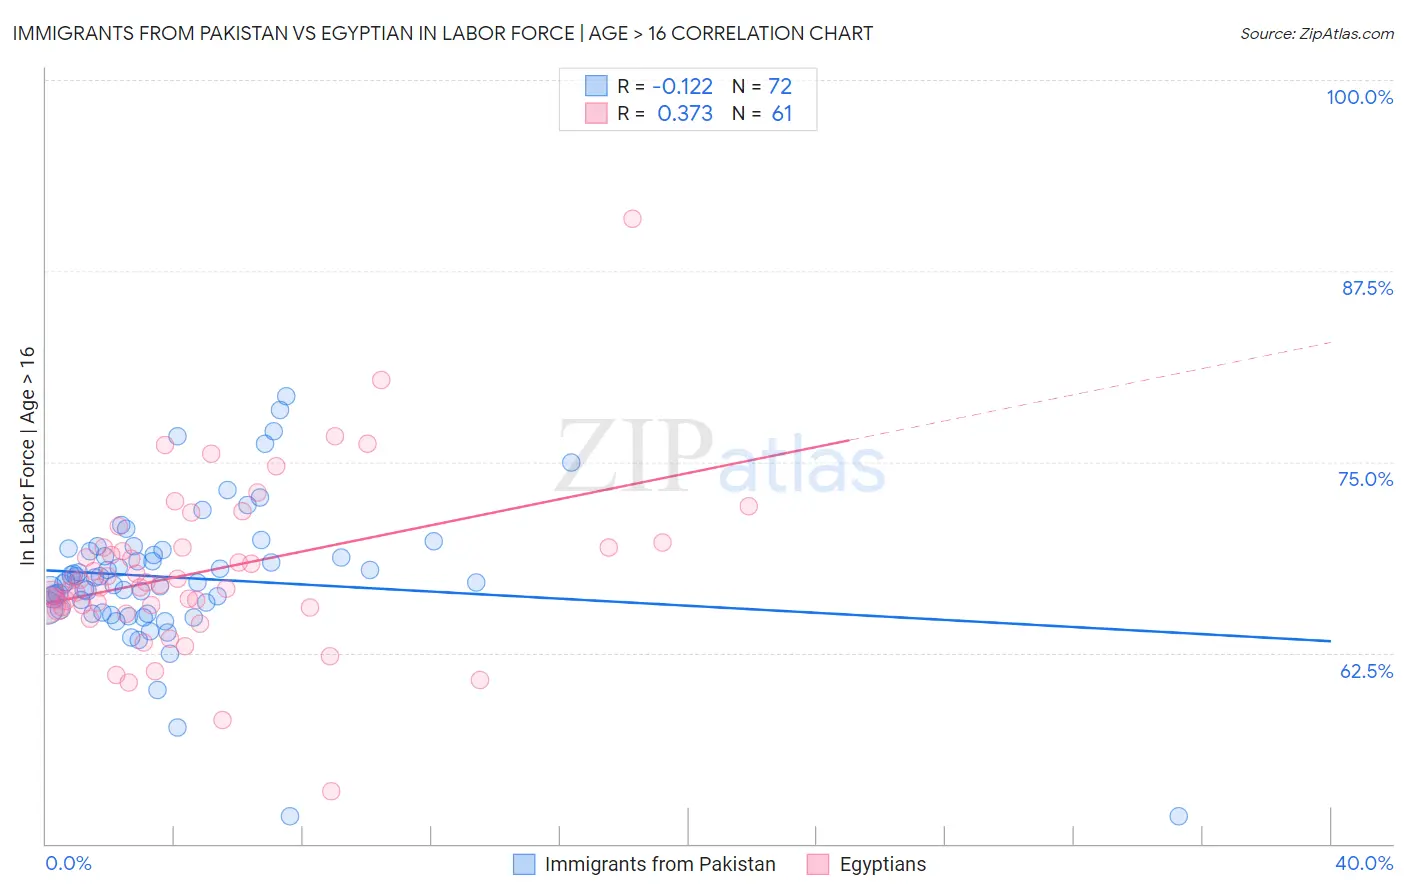
Immigrants from Pakistan vs Egyptian In Labor Force | Age > 16 Correlation Chart
The statistical analysis conducted on geographies consisting of 283,909,562 people shows a poor negative correlation between the proportion of Immigrants from Pakistan and labor force participation rate among population ages 16 and over in the United States with a correlation coefficient (R) of -0.122 and weighted average of 66.7%. Similarly, the statistical analysis conducted on geographies consisting of 276,931,154 people shows a mild positive correlation between the proportion of Egyptians and labor force participation rate among population ages 16 and over in the United States with a correlation coefficient (R) of 0.373 and weighted average of 66.2%, a difference of 0.69%.
In Labor Force | Age > 16 Correlation Summary
| Measurement | Immigrants from Pakistan | Egyptian |
| Minimum | 51.8% | 53.4% |
| Maximum | 79.3% | 90.9% |
| Range | 27.5% | 37.5% |
| Mean | 67.4% | 67.8% |
| Median | 67.1% | 66.9% |
| Interquartile 25% (IQ1) | 65.3% | 65.5% |
| Interquartile 75% (IQ3) | 69.2% | 69.4% |
| Interquartile Range (IQR) | 3.9% | 3.9% |
| Standard Deviation (Sample) | 4.7% | 5.5% |
| Standard Deviation (Population) | 4.6% | 5.5% |
Similar Demographics by In Labor Force | Age > 16
Demographics Similar to Immigrants from Pakistan by In Labor Force | Age > 16
In terms of in labor force | age > 16, the demographic groups most similar to Immigrants from Pakistan are Luxembourger (66.7%, a difference of 0.050%), Immigrants from Brazil (66.7%, a difference of 0.050%), Senegalese (66.7%, a difference of 0.070%), Brazilian (66.6%, a difference of 0.12%), and Immigrants from Bulgaria (66.6%, a difference of 0.12%).
| Demographics | Rating | Rank | In Labor Force | Age > 16 |
| Immigrants | Afghanistan | 100.0 /100 | #37 | Exceptional 67.0% |
| Immigrants | Nigeria | 100.0 /100 | #38 | Exceptional 66.9% |
| Salvadorans | 100.0 /100 | #39 | Exceptional 66.8% |
| Immigrants | El Salvador | 100.0 /100 | #40 | Exceptional 66.8% |
| Immigrants | Zimbabwe | 100.0 /100 | #41 | Exceptional 66.8% |
| Senegalese | 100.0 /100 | #42 | Exceptional 66.7% |
| Luxembourgers | 100.0 /100 | #43 | Exceptional 66.7% |
| Immigrants | Pakistan | 100.0 /100 | #44 | Exceptional 66.7% |
| Immigrants | Brazil | 100.0 /100 | #45 | Exceptional 66.7% |
| Brazilians | 100.0 /100 | #46 | Exceptional 66.6% |
| Immigrants | Bulgaria | 100.0 /100 | #47 | Exceptional 66.6% |
| Nigerians | 100.0 /100 | #48 | Exceptional 66.6% |
| Immigrants | Northern Africa | 100.0 /100 | #49 | Exceptional 66.6% |
| Cape Verdeans | 100.0 /100 | #50 | Exceptional 66.6% |
| Immigrants | Kuwait | 100.0 /100 | #51 | Exceptional 66.5% |
Demographics Similar to Egyptians by In Labor Force | Age > 16
In terms of in labor force | age > 16, the demographic groups most similar to Egyptians are Jordanian (66.3%, a difference of 0.020%), Sri Lankan (66.3%, a difference of 0.050%), Immigrants from Egypt (66.2%, a difference of 0.050%), Subsaharan African (66.2%, a difference of 0.050%), and Venezuelan (66.3%, a difference of 0.060%).
| Demographics | Rating | Rank | In Labor Force | Age > 16 |
| Immigrants | Peru | 99.8 /100 | #60 | Exceptional 66.3% |
| Immigrants | Burma/Myanmar | 99.8 /100 | #61 | Exceptional 66.3% |
| Indonesians | 99.8 /100 | #62 | Exceptional 66.3% |
| Venezuelans | 99.8 /100 | #63 | Exceptional 66.3% |
| Peruvians | 99.8 /100 | #64 | Exceptional 66.3% |
| Sri Lankans | 99.8 /100 | #65 | Exceptional 66.3% |
| Jordanians | 99.8 /100 | #66 | Exceptional 66.3% |
| Egyptians | 99.8 /100 | #67 | Exceptional 66.2% |
| Immigrants | Egypt | 99.7 /100 | #68 | Exceptional 66.2% |
| Sub-Saharan Africans | 99.7 /100 | #69 | Exceptional 66.2% |
| Asians | 99.7 /100 | #70 | Exceptional 66.2% |
| Burmese | 99.7 /100 | #71 | Exceptional 66.2% |
| Taiwanese | 99.7 /100 | #72 | Exceptional 66.2% |
| Immigrants | Vietnam | 99.7 /100 | #73 | Exceptional 66.2% |
| Immigrants | Korea | 99.7 /100 | #74 | Exceptional 66.2% |