Japanese vs Potawatomi In Labor Force | Age > 16
COMPARE
Japanese
Potawatomi
In Labor Force | Age > 16
In Labor Force | Age > 16 Comparison
Japanese
Potawatomi
65.8%
IN LABOR FORCE | AGE > 16
97.7/ 100
METRIC RATING
110th/ 347
METRIC RANK
62.8%
IN LABOR FORCE | AGE > 16
0.0/ 100
METRIC RATING
315th/ 347
METRIC RANK
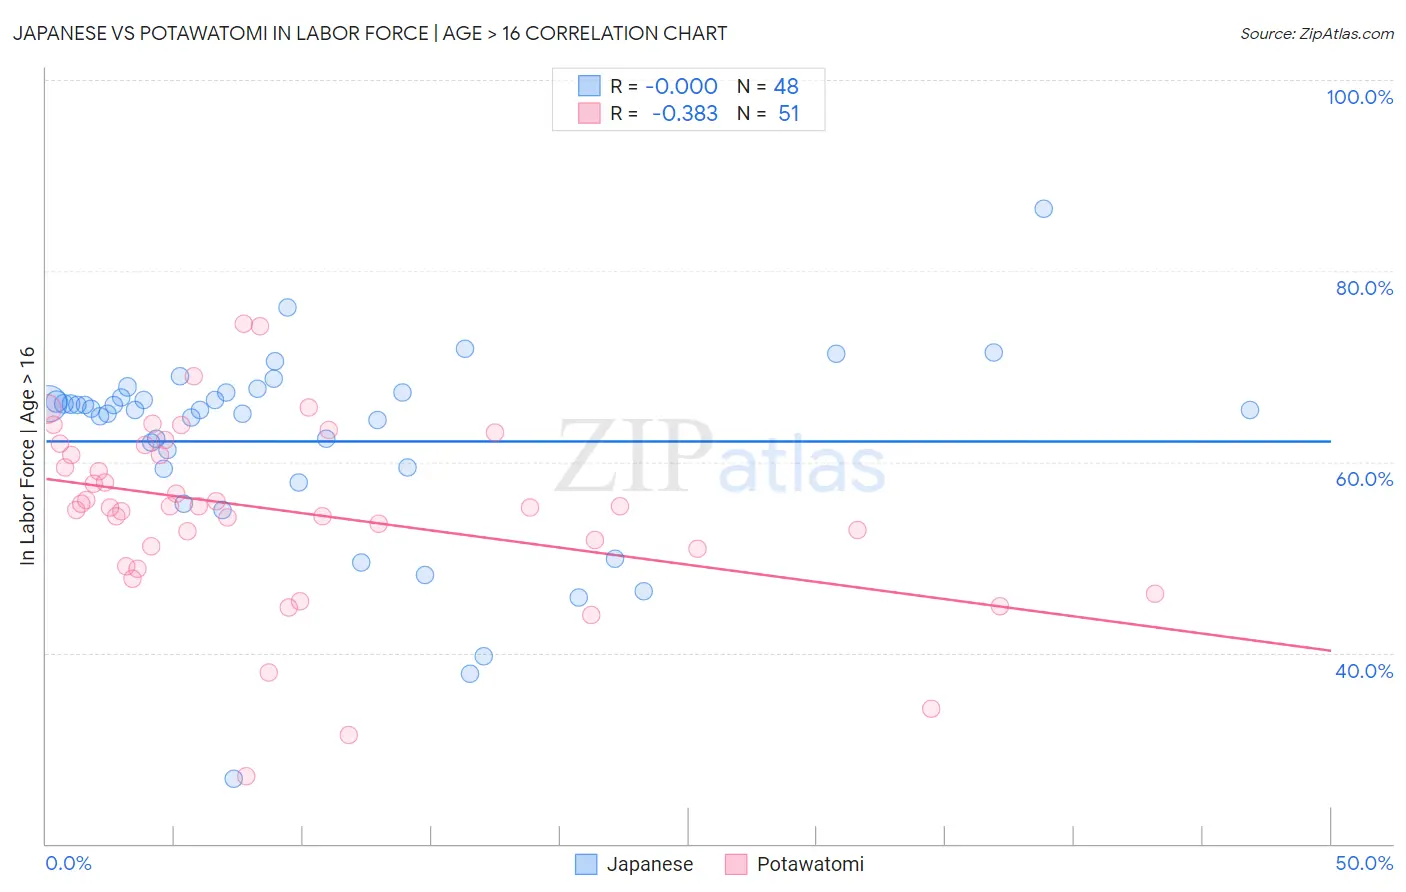
Japanese vs Potawatomi In Labor Force | Age > 16 Correlation Chart
The statistical analysis conducted on geographies consisting of 249,190,051 people shows no correlation between the proportion of Japanese and labor force participation rate among population ages 16 and over in the United States with a correlation coefficient (R) of -0.000 and weighted average of 65.8%. Similarly, the statistical analysis conducted on geographies consisting of 117,774,216 people shows a mild negative correlation between the proportion of Potawatomi and labor force participation rate among population ages 16 and over in the United States with a correlation coefficient (R) of -0.383 and weighted average of 62.8%, a difference of 4.7%.
In Labor Force | Age > 16 Correlation Summary
| Measurement | Japanese | Potawatomi |
| Minimum | 26.8% | 27.1% |
| Maximum | 86.5% | 74.5% |
| Range | 59.7% | 47.4% |
| Mean | 62.1% | 54.8% |
| Median | 65.4% | 55.3% |
| Interquartile 25% (IQ1) | 59.4% | 50.9% |
| Interquartile 75% (IQ3) | 67.0% | 61.7% |
| Interquartile Range (IQR) | 7.6% | 10.8% |
| Standard Deviation (Sample) | 10.4% | 9.5% |
| Standard Deviation (Population) | 10.3% | 9.4% |
Similar Demographics by In Labor Force | Age > 16
Demographics Similar to Japanese by In Labor Force | Age > 16
In terms of in labor force | age > 16, the demographic groups most similar to Japanese are Immigrants from Honduras (65.8%, a difference of 0.020%), Immigrants from Spain (65.8%, a difference of 0.040%), Immigrants from Japan (65.8%, a difference of 0.040%), Laotian (65.8%, a difference of 0.040%), and Immigrants from Poland (65.8%, a difference of 0.050%).
| Demographics | Rating | Rank | In Labor Force | Age > 16 |
| Immigrants | South Eastern Asia | 98.5 /100 | #103 | Exceptional 65.9% |
| Palestinians | 98.5 /100 | #104 | Exceptional 65.9% |
| Colombians | 98.4 /100 | #105 | Exceptional 65.9% |
| Immigrants | Serbia | 98.1 /100 | #106 | Exceptional 65.8% |
| Immigrants | Poland | 98.1 /100 | #107 | Exceptional 65.8% |
| Immigrants | Spain | 98.0 /100 | #108 | Exceptional 65.8% |
| Immigrants | Japan | 98.0 /100 | #109 | Exceptional 65.8% |
| Japanese | 97.7 /100 | #110 | Exceptional 65.8% |
| Immigrants | Honduras | 97.5 /100 | #111 | Exceptional 65.8% |
| Laotians | 97.4 /100 | #112 | Exceptional 65.8% |
| Pakistanis | 97.1 /100 | #113 | Exceptional 65.8% |
| Hondurans | 97.1 /100 | #114 | Exceptional 65.8% |
| Immigrants | Indonesia | 96.8 /100 | #115 | Exceptional 65.7% |
| Argentineans | 96.7 /100 | #116 | Exceptional 65.7% |
| Immigrants | Iran | 96.6 /100 | #117 | Exceptional 65.7% |
Demographics Similar to Potawatomi by In Labor Force | Age > 16
In terms of in labor force | age > 16, the demographic groups most similar to Potawatomi are Yup'ik (62.7%, a difference of 0.22%), Yaqui (63.0%, a difference of 0.35%), Chippewa (63.1%, a difference of 0.44%), Iroquois (63.2%, a difference of 0.57%), and Blackfeet (63.2%, a difference of 0.64%).
| Demographics | Rating | Rank | In Labor Force | Age > 16 |
| Pennsylvania Germans | 0.0 /100 | #308 | Tragic 63.4% |
| Scotch-Irish | 0.0 /100 | #309 | Tragic 63.3% |
| Shoshone | 0.0 /100 | #310 | Tragic 63.2% |
| Blackfeet | 0.0 /100 | #311 | Tragic 63.2% |
| Iroquois | 0.0 /100 | #312 | Tragic 63.2% |
| Chippewa | 0.0 /100 | #313 | Tragic 63.1% |
| Yaqui | 0.0 /100 | #314 | Tragic 63.0% |
| Potawatomi | 0.0 /100 | #315 | Tragic 62.8% |
| Yup'ik | 0.0 /100 | #316 | Tragic 62.7% |
| Kiowa | 0.0 /100 | #317 | Tragic 62.4% |
| Chickasaw | 0.0 /100 | #318 | Tragic 62.3% |
| Arapaho | 0.0 /100 | #319 | Tragic 62.1% |
| Yakama | 0.0 /100 | #320 | Tragic 62.1% |
| Americans | 0.0 /100 | #321 | Tragic 62.1% |
| Ottawa | 0.0 /100 | #322 | Tragic 62.0% |