Immigrants from Pakistan vs Immigrants from Portugal In Labor Force | Age > 16
COMPARE
Immigrants from Pakistan
Immigrants from Portugal
In Labor Force | Age > 16
In Labor Force | Age > 16 Comparison
Immigrants from Pakistan
Immigrants from Portugal
66.7%
IN LABOR FORCE | AGE > 16
100.0/ 100
METRIC RATING
44th/ 347
METRIC RANK
65.0%
IN LABOR FORCE | AGE > 16
34.8/ 100
METRIC RATING
188th/ 347
METRIC RANK
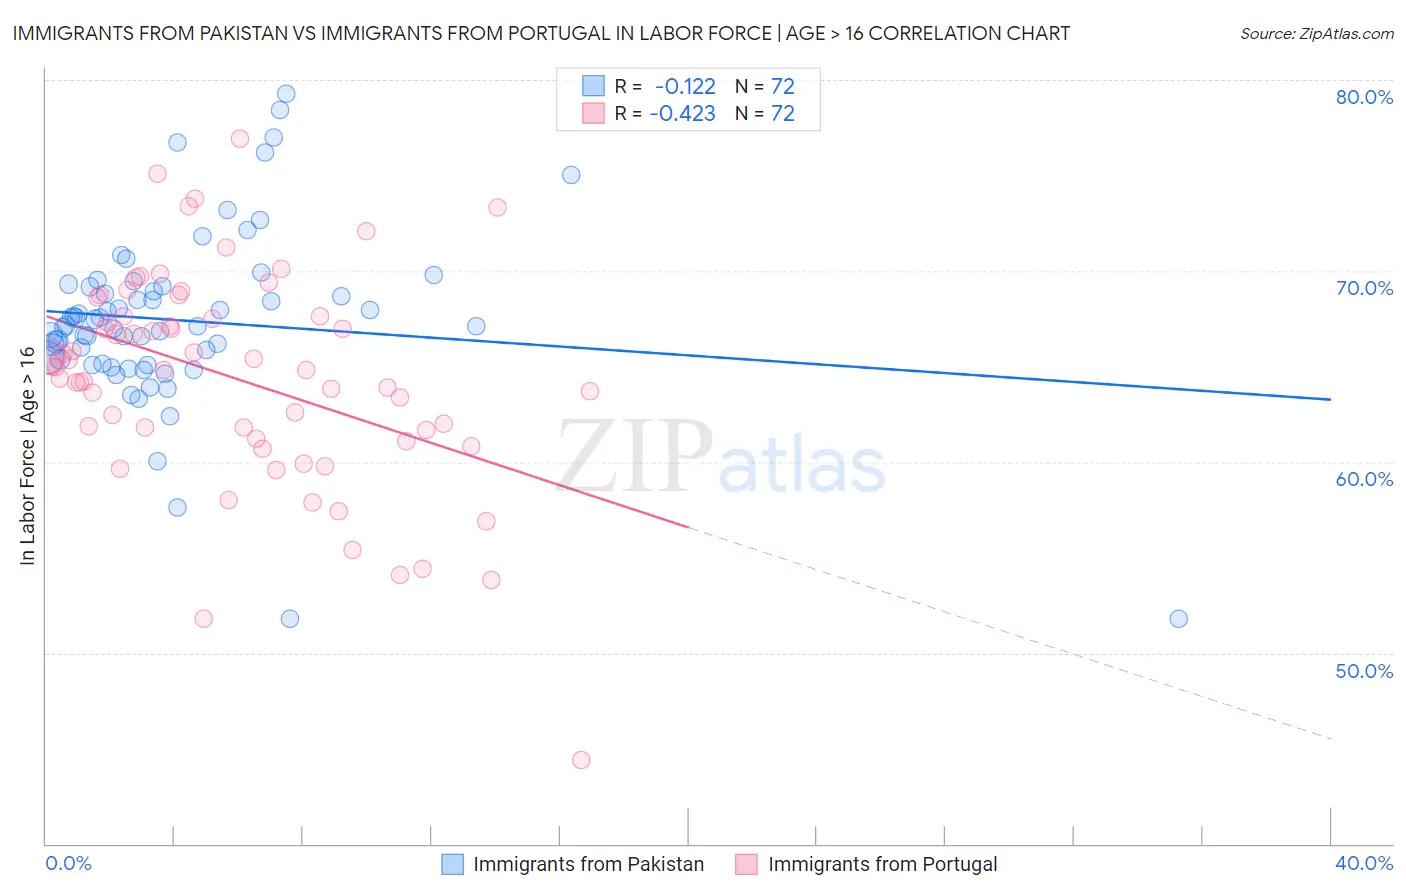
Immigrants from Pakistan vs Immigrants from Portugal In Labor Force | Age > 16 Correlation Chart
The statistical analysis conducted on geographies consisting of 283,909,562 people shows a poor negative correlation between the proportion of Immigrants from Pakistan and labor force participation rate among population ages 16 and over in the United States with a correlation coefficient (R) of -0.122 and weighted average of 66.7%. Similarly, the statistical analysis conducted on geographies consisting of 174,779,205 people shows a moderate negative correlation between the proportion of Immigrants from Portugal and labor force participation rate among population ages 16 and over in the United States with a correlation coefficient (R) of -0.423 and weighted average of 65.0%, a difference of 2.6%.
In Labor Force | Age > 16 Correlation Summary
| Measurement | Immigrants from Pakistan | Immigrants from Portugal |
| Minimum | 51.8% | 44.4% |
| Maximum | 79.3% | 76.9% |
| Range | 27.5% | 32.5% |
| Mean | 67.4% | 64.4% |
| Median | 67.1% | 64.9% |
| Interquartile 25% (IQ1) | 65.3% | 61.5% |
| Interquartile 75% (IQ3) | 69.2% | 67.6% |
| Interquartile Range (IQR) | 3.9% | 6.2% |
| Standard Deviation (Sample) | 4.7% | 5.7% |
| Standard Deviation (Population) | 4.6% | 5.6% |
Similar Demographics by In Labor Force | Age > 16
Demographics Similar to Immigrants from Pakistan by In Labor Force | Age > 16
In terms of in labor force | age > 16, the demographic groups most similar to Immigrants from Pakistan are Luxembourger (66.7%, a difference of 0.050%), Immigrants from Brazil (66.7%, a difference of 0.050%), Senegalese (66.7%, a difference of 0.070%), Brazilian (66.6%, a difference of 0.12%), and Immigrants from Bulgaria (66.6%, a difference of 0.12%).
| Demographics | Rating | Rank | In Labor Force | Age > 16 |
| Immigrants | Afghanistan | 100.0 /100 | #37 | Exceptional 67.0% |
| Immigrants | Nigeria | 100.0 /100 | #38 | Exceptional 66.9% |
| Salvadorans | 100.0 /100 | #39 | Exceptional 66.8% |
| Immigrants | El Salvador | 100.0 /100 | #40 | Exceptional 66.8% |
| Immigrants | Zimbabwe | 100.0 /100 | #41 | Exceptional 66.8% |
| Senegalese | 100.0 /100 | #42 | Exceptional 66.7% |
| Luxembourgers | 100.0 /100 | #43 | Exceptional 66.7% |
| Immigrants | Pakistan | 100.0 /100 | #44 | Exceptional 66.7% |
| Immigrants | Brazil | 100.0 /100 | #45 | Exceptional 66.7% |
| Brazilians | 100.0 /100 | #46 | Exceptional 66.6% |
| Immigrants | Bulgaria | 100.0 /100 | #47 | Exceptional 66.6% |
| Nigerians | 100.0 /100 | #48 | Exceptional 66.6% |
| Immigrants | Northern Africa | 100.0 /100 | #49 | Exceptional 66.6% |
| Cape Verdeans | 100.0 /100 | #50 | Exceptional 66.6% |
| Immigrants | Kuwait | 100.0 /100 | #51 | Exceptional 66.5% |
Demographics Similar to Immigrants from Portugal by In Labor Force | Age > 16
In terms of in labor force | age > 16, the demographic groups most similar to Immigrants from Portugal are Immigrants from Croatia (65.0%, a difference of 0.010%), Immigrants from Greece (65.0%, a difference of 0.010%), Barbadian (65.0%, a difference of 0.010%), Scandinavian (65.0%, a difference of 0.010%), and Immigrants from Fiji (65.0%, a difference of 0.010%).
| Demographics | Rating | Rank | In Labor Force | Age > 16 |
| Immigrants | Panama | 42.4 /100 | #181 | Average 65.1% |
| Immigrants | Nicaragua | 41.1 /100 | #182 | Average 65.1% |
| Soviet Union | 40.5 /100 | #183 | Average 65.0% |
| Carpatho Rusyns | 40.0 /100 | #184 | Average 65.0% |
| Syrians | 40.0 /100 | #185 | Average 65.0% |
| Immigrants | Switzerland | 38.2 /100 | #186 | Fair 65.0% |
| Immigrants | Croatia | 35.7 /100 | #187 | Fair 65.0% |
| Immigrants | Portugal | 34.8 /100 | #188 | Fair 65.0% |
| Immigrants | Greece | 34.3 /100 | #189 | Fair 65.0% |
| Barbadians | 33.9 /100 | #190 | Fair 65.0% |
| Scandinavians | 33.7 /100 | #191 | Fair 65.0% |
| Immigrants | Fiji | 33.7 /100 | #192 | Fair 65.0% |
| Immigrants | Europe | 33.6 /100 | #193 | Fair 65.0% |
| Immigrants | Southern Europe | 31.3 /100 | #194 | Fair 65.0% |
| Romanians | 31.1 /100 | #195 | Fair 65.0% |