Immigrants from Central America vs Potawatomi In Labor Force | Age > 16
COMPARE
Immigrants from Central America
Potawatomi
In Labor Force | Age > 16
In Labor Force | Age > 16 Comparison
Immigrants from Central America
Potawatomi
64.7%
IN LABOR FORCE | AGE > 16
10.5/ 100
METRIC RATING
219th/ 347
METRIC RANK
62.8%
IN LABOR FORCE | AGE > 16
0.0/ 100
METRIC RATING
315th/ 347
METRIC RANK
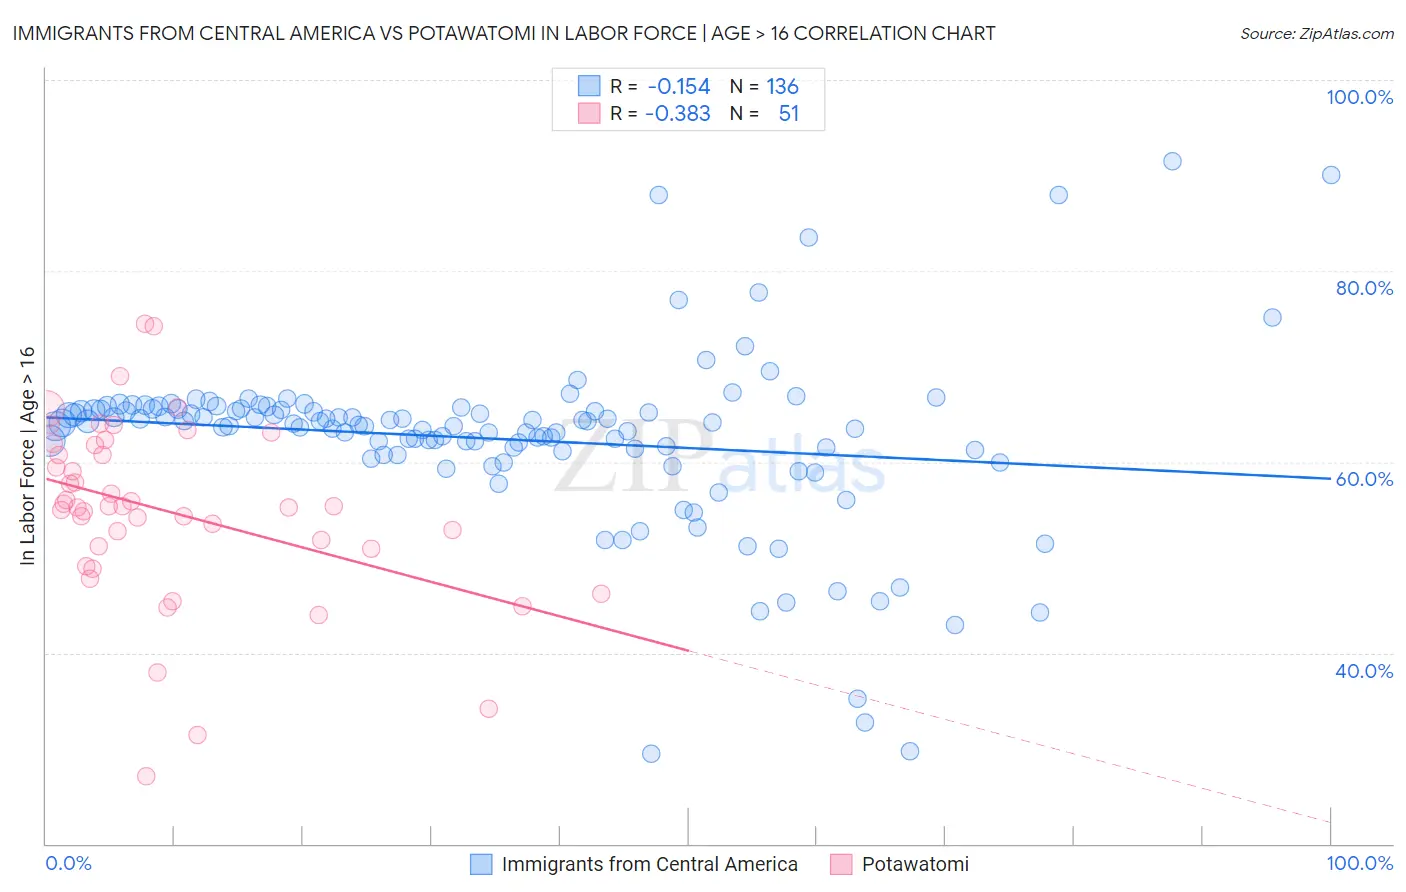
Immigrants from Central America vs Potawatomi In Labor Force | Age > 16 Correlation Chart
The statistical analysis conducted on geographies consisting of 536,509,301 people shows a poor negative correlation between the proportion of Immigrants from Central America and labor force participation rate among population ages 16 and over in the United States with a correlation coefficient (R) of -0.154 and weighted average of 64.7%. Similarly, the statistical analysis conducted on geographies consisting of 117,774,216 people shows a mild negative correlation between the proportion of Potawatomi and labor force participation rate among population ages 16 and over in the United States with a correlation coefficient (R) of -0.383 and weighted average of 62.8%, a difference of 3.0%.
In Labor Force | Age > 16 Correlation Summary
| Measurement | Immigrants from Central America | Potawatomi |
| Minimum | 29.4% | 27.1% |
| Maximum | 91.5% | 74.5% |
| Range | 62.1% | 47.4% |
| Mean | 62.4% | 54.8% |
| Median | 64.0% | 55.3% |
| Interquartile 25% (IQ1) | 61.2% | 50.9% |
| Interquartile 75% (IQ3) | 65.5% | 61.7% |
| Interquartile Range (IQR) | 4.3% | 10.8% |
| Standard Deviation (Sample) | 9.3% | 9.5% |
| Standard Deviation (Population) | 9.3% | 9.4% |
Similar Demographics by In Labor Force | Age > 16
Demographics Similar to Immigrants from Central America by In Labor Force | Age > 16
In terms of in labor force | age > 16, the demographic groups most similar to Immigrants from Central America are Alsatian (64.7%, a difference of 0.010%), Belgian (64.7%, a difference of 0.020%), U.S. Virgin Islander (64.7%, a difference of 0.020%), Alaska Native (64.7%, a difference of 0.020%), and Immigrants from Micronesia (64.7%, a difference of 0.030%).
| Demographics | Rating | Rank | In Labor Force | Age > 16 |
| Alaskan Athabascans | 13.9 /100 | #212 | Poor 64.8% |
| Maltese | 13.8 /100 | #213 | Poor 64.8% |
| Estonians | 13.1 /100 | #214 | Poor 64.8% |
| Immigrants | Czechoslovakia | 12.3 /100 | #215 | Poor 64.8% |
| Belgians | 11.4 /100 | #216 | Poor 64.7% |
| U.S. Virgin Islanders | 11.3 /100 | #217 | Poor 64.7% |
| Alsatians | 10.7 /100 | #218 | Poor 64.7% |
| Immigrants | Central America | 10.5 /100 | #219 | Poor 64.7% |
| Alaska Natives | 9.9 /100 | #220 | Tragic 64.7% |
| Immigrants | Micronesia | 9.6 /100 | #221 | Tragic 64.7% |
| Hawaiians | 9.3 /100 | #222 | Tragic 64.7% |
| Immigrants | Belize | 9.2 /100 | #223 | Tragic 64.7% |
| Immigrants | Jamaica | 8.8 /100 | #224 | Tragic 64.7% |
| Croatians | 8.8 /100 | #225 | Tragic 64.7% |
| Europeans | 8.3 /100 | #226 | Tragic 64.7% |
Demographics Similar to Potawatomi by In Labor Force | Age > 16
In terms of in labor force | age > 16, the demographic groups most similar to Potawatomi are Yup'ik (62.7%, a difference of 0.22%), Yaqui (63.0%, a difference of 0.35%), Chippewa (63.1%, a difference of 0.44%), Iroquois (63.2%, a difference of 0.57%), and Blackfeet (63.2%, a difference of 0.64%).
| Demographics | Rating | Rank | In Labor Force | Age > 16 |
| Pennsylvania Germans | 0.0 /100 | #308 | Tragic 63.4% |
| Scotch-Irish | 0.0 /100 | #309 | Tragic 63.3% |
| Shoshone | 0.0 /100 | #310 | Tragic 63.2% |
| Blackfeet | 0.0 /100 | #311 | Tragic 63.2% |
| Iroquois | 0.0 /100 | #312 | Tragic 63.2% |
| Chippewa | 0.0 /100 | #313 | Tragic 63.1% |
| Yaqui | 0.0 /100 | #314 | Tragic 63.0% |
| Potawatomi | 0.0 /100 | #315 | Tragic 62.8% |
| Yup'ik | 0.0 /100 | #316 | Tragic 62.7% |
| Kiowa | 0.0 /100 | #317 | Tragic 62.4% |
| Chickasaw | 0.0 /100 | #318 | Tragic 62.3% |
| Arapaho | 0.0 /100 | #319 | Tragic 62.1% |
| Yakama | 0.0 /100 | #320 | Tragic 62.1% |
| Americans | 0.0 /100 | #321 | Tragic 62.1% |
| Ottawa | 0.0 /100 | #322 | Tragic 62.0% |