Immigrants from Congo vs Potawatomi In Labor Force | Age > 16
COMPARE
Immigrants from Congo
Potawatomi
In Labor Force | Age > 16
In Labor Force | Age > 16 Comparison
Immigrants from Congo
Potawatomi
67.1%
IN LABOR FORCE | AGE > 16
100.0/ 100
METRIC RATING
32nd/ 347
METRIC RANK
62.8%
IN LABOR FORCE | AGE > 16
0.0/ 100
METRIC RATING
315th/ 347
METRIC RANK
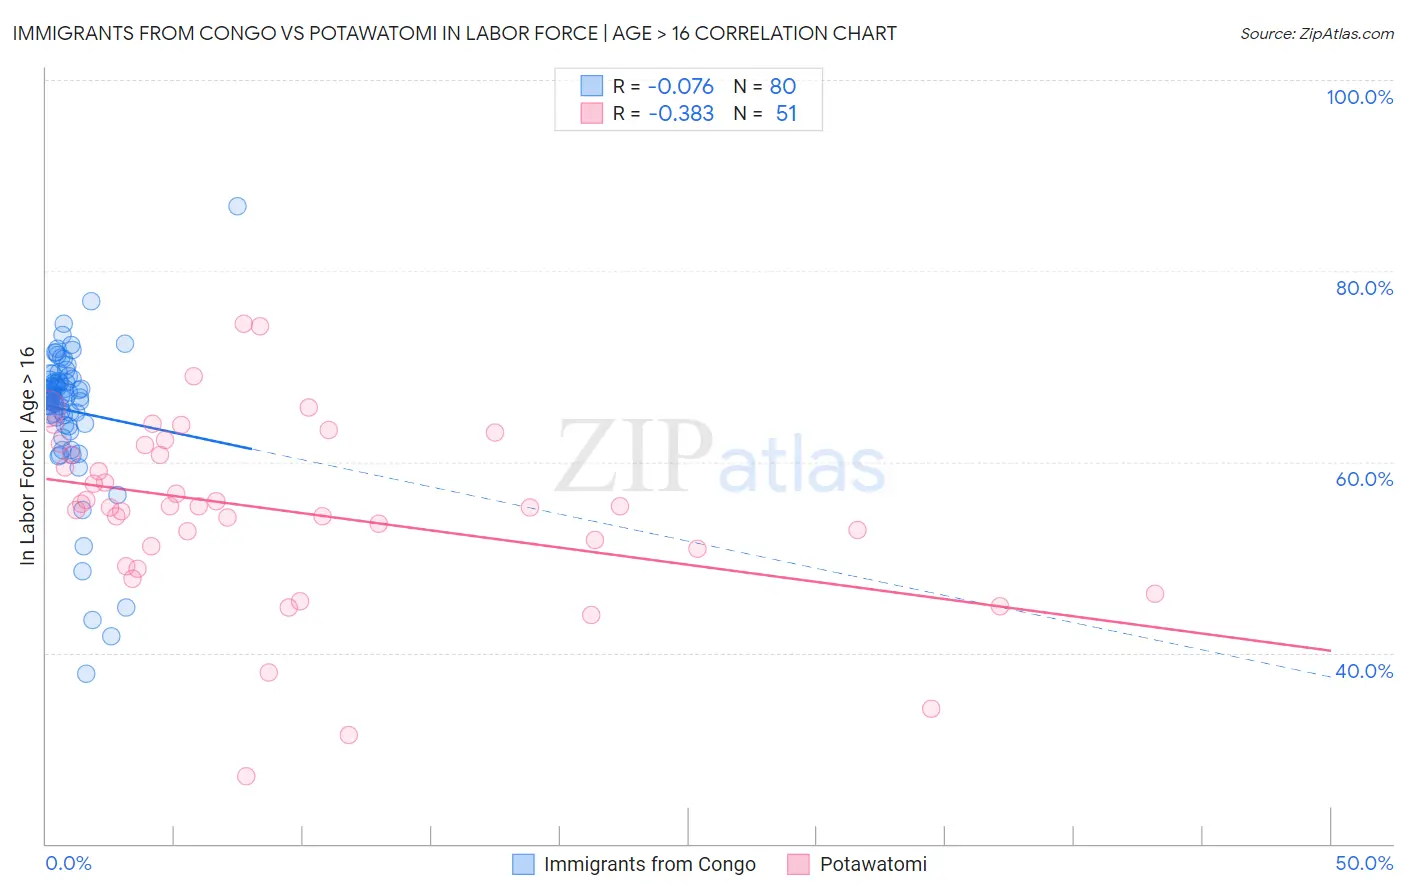
Immigrants from Congo vs Potawatomi In Labor Force | Age > 16 Correlation Chart
The statistical analysis conducted on geographies consisting of 92,129,705 people shows a slight negative correlation between the proportion of Immigrants from Congo and labor force participation rate among population ages 16 and over in the United States with a correlation coefficient (R) of -0.076 and weighted average of 67.1%. Similarly, the statistical analysis conducted on geographies consisting of 117,774,216 people shows a mild negative correlation between the proportion of Potawatomi and labor force participation rate among population ages 16 and over in the United States with a correlation coefficient (R) of -0.383 and weighted average of 62.8%, a difference of 6.8%.
In Labor Force | Age > 16 Correlation Summary
| Measurement | Immigrants from Congo | Potawatomi |
| Minimum | 37.8% | 27.1% |
| Maximum | 86.8% | 74.5% |
| Range | 49.0% | 47.4% |
| Mean | 65.4% | 54.8% |
| Median | 66.8% | 55.3% |
| Interquartile 25% (IQ1) | 64.3% | 50.9% |
| Interquartile 75% (IQ3) | 68.6% | 61.7% |
| Interquartile Range (IQR) | 4.3% | 10.8% |
| Standard Deviation (Sample) | 7.5% | 9.5% |
| Standard Deviation (Population) | 7.4% | 9.4% |
Similar Demographics by In Labor Force | Age > 16
Demographics Similar to Immigrants from Congo by In Labor Force | Age > 16
In terms of in labor force | age > 16, the demographic groups most similar to Immigrants from Congo are Afghan (67.1%, a difference of 0.0%), Immigrants from Ghana (67.1%, a difference of 0.020%), Ghanaian (67.1%, a difference of 0.060%), Immigrants from South Central Asia (67.1%, a difference of 0.070%), and Immigrants from Western Africa (67.1%, a difference of 0.070%).
| Demographics | Rating | Rank | In Labor Force | Age > 16 |
| Immigrants | Africa | 100.0 /100 | #25 | Exceptional 67.4% |
| Immigrants | Cabo Verde | 100.0 /100 | #26 | Exceptional 67.3% |
| Zimbabweans | 100.0 /100 | #27 | Exceptional 67.3% |
| Immigrants | Morocco | 100.0 /100 | #28 | Exceptional 67.2% |
| Thais | 100.0 /100 | #29 | Exceptional 67.2% |
| Immigrants | Zaire | 100.0 /100 | #30 | Exceptional 67.2% |
| Ghanaians | 100.0 /100 | #31 | Exceptional 67.1% |
| Immigrants | Congo | 100.0 /100 | #32 | Exceptional 67.1% |
| Afghans | 100.0 /100 | #33 | Exceptional 67.1% |
| Immigrants | Ghana | 100.0 /100 | #34 | Exceptional 67.1% |
| Immigrants | South Central Asia | 100.0 /100 | #35 | Exceptional 67.1% |
| Immigrants | Western Africa | 100.0 /100 | #36 | Exceptional 67.1% |
| Immigrants | Afghanistan | 100.0 /100 | #37 | Exceptional 67.0% |
| Immigrants | Nigeria | 100.0 /100 | #38 | Exceptional 66.9% |
| Salvadorans | 100.0 /100 | #39 | Exceptional 66.8% |
Demographics Similar to Potawatomi by In Labor Force | Age > 16
In terms of in labor force | age > 16, the demographic groups most similar to Potawatomi are Yup'ik (62.7%, a difference of 0.22%), Yaqui (63.0%, a difference of 0.35%), Chippewa (63.1%, a difference of 0.44%), Iroquois (63.2%, a difference of 0.57%), and Blackfeet (63.2%, a difference of 0.64%).
| Demographics | Rating | Rank | In Labor Force | Age > 16 |
| Pennsylvania Germans | 0.0 /100 | #308 | Tragic 63.4% |
| Scotch-Irish | 0.0 /100 | #309 | Tragic 63.3% |
| Shoshone | 0.0 /100 | #310 | Tragic 63.2% |
| Blackfeet | 0.0 /100 | #311 | Tragic 63.2% |
| Iroquois | 0.0 /100 | #312 | Tragic 63.2% |
| Chippewa | 0.0 /100 | #313 | Tragic 63.1% |
| Yaqui | 0.0 /100 | #314 | Tragic 63.0% |
| Potawatomi | 0.0 /100 | #315 | Tragic 62.8% |
| Yup'ik | 0.0 /100 | #316 | Tragic 62.7% |
| Kiowa | 0.0 /100 | #317 | Tragic 62.4% |
| Chickasaw | 0.0 /100 | #318 | Tragic 62.3% |
| Arapaho | 0.0 /100 | #319 | Tragic 62.1% |
| Yakama | 0.0 /100 | #320 | Tragic 62.1% |
| Americans | 0.0 /100 | #321 | Tragic 62.1% |
| Ottawa | 0.0 /100 | #322 | Tragic 62.0% |