Immigrants from Pakistan vs Filipino In Labor Force | Age > 16
COMPARE
Immigrants from Pakistan
Filipino
In Labor Force | Age > 16
In Labor Force | Age > 16 Comparison
Immigrants from Pakistan
Filipinos
66.7%
IN LABOR FORCE | AGE > 16
100.0/ 100
METRIC RATING
44th/ 347
METRIC RANK
65.9%
IN LABOR FORCE | AGE > 16
98.9/ 100
METRIC RATING
97th/ 347
METRIC RANK
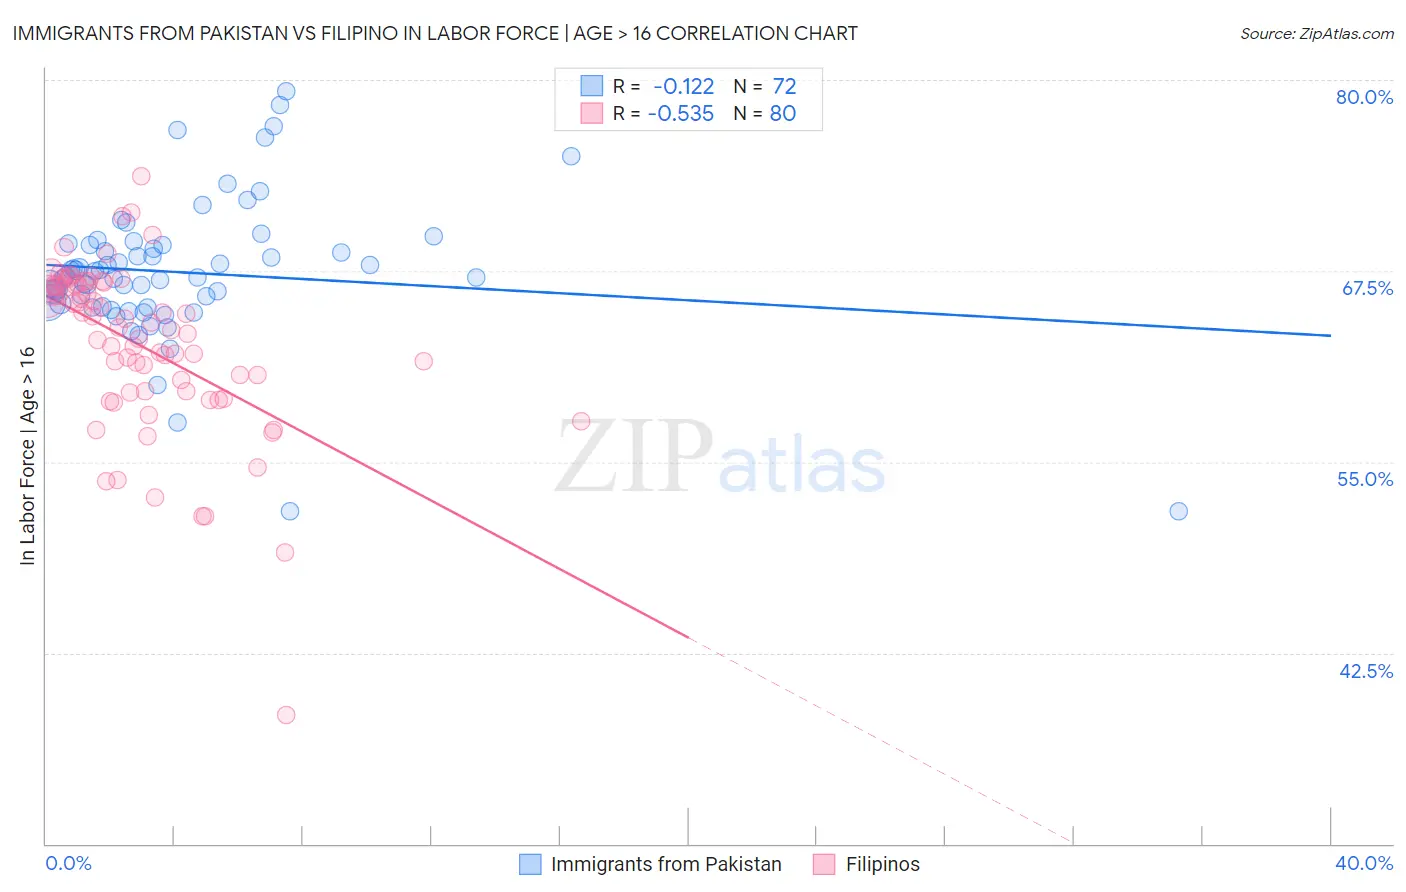
Immigrants from Pakistan vs Filipino In Labor Force | Age > 16 Correlation Chart
The statistical analysis conducted on geographies consisting of 283,909,562 people shows a poor negative correlation between the proportion of Immigrants from Pakistan and labor force participation rate among population ages 16 and over in the United States with a correlation coefficient (R) of -0.122 and weighted average of 66.7%. Similarly, the statistical analysis conducted on geographies consisting of 254,350,604 people shows a substantial negative correlation between the proportion of Filipinos and labor force participation rate among population ages 16 and over in the United States with a correlation coefficient (R) of -0.535 and weighted average of 65.9%, a difference of 1.1%.
In Labor Force | Age > 16 Correlation Summary
| Measurement | Immigrants from Pakistan | Filipino |
| Minimum | 51.8% | 38.4% |
| Maximum | 79.3% | 73.7% |
| Range | 27.5% | 35.3% |
| Mean | 67.4% | 62.6% |
| Median | 67.1% | 63.7% |
| Interquartile 25% (IQ1) | 65.3% | 59.6% |
| Interquartile 75% (IQ3) | 69.2% | 66.6% |
| Interquartile Range (IQR) | 3.9% | 7.0% |
| Standard Deviation (Sample) | 4.7% | 5.6% |
| Standard Deviation (Population) | 4.6% | 5.5% |
Similar Demographics by In Labor Force | Age > 16
Demographics Similar to Immigrants from Pakistan by In Labor Force | Age > 16
In terms of in labor force | age > 16, the demographic groups most similar to Immigrants from Pakistan are Luxembourger (66.7%, a difference of 0.050%), Immigrants from Brazil (66.7%, a difference of 0.050%), Senegalese (66.7%, a difference of 0.070%), Brazilian (66.6%, a difference of 0.12%), and Immigrants from Bulgaria (66.6%, a difference of 0.12%).
| Demographics | Rating | Rank | In Labor Force | Age > 16 |
| Immigrants | Afghanistan | 100.0 /100 | #37 | Exceptional 67.0% |
| Immigrants | Nigeria | 100.0 /100 | #38 | Exceptional 66.9% |
| Salvadorans | 100.0 /100 | #39 | Exceptional 66.8% |
| Immigrants | El Salvador | 100.0 /100 | #40 | Exceptional 66.8% |
| Immigrants | Zimbabwe | 100.0 /100 | #41 | Exceptional 66.8% |
| Senegalese | 100.0 /100 | #42 | Exceptional 66.7% |
| Luxembourgers | 100.0 /100 | #43 | Exceptional 66.7% |
| Immigrants | Pakistan | 100.0 /100 | #44 | Exceptional 66.7% |
| Immigrants | Brazil | 100.0 /100 | #45 | Exceptional 66.7% |
| Brazilians | 100.0 /100 | #46 | Exceptional 66.6% |
| Immigrants | Bulgaria | 100.0 /100 | #47 | Exceptional 66.6% |
| Nigerians | 100.0 /100 | #48 | Exceptional 66.6% |
| Immigrants | Northern Africa | 100.0 /100 | #49 | Exceptional 66.6% |
| Cape Verdeans | 100.0 /100 | #50 | Exceptional 66.6% |
| Immigrants | Kuwait | 100.0 /100 | #51 | Exceptional 66.5% |
Demographics Similar to Filipinos by In Labor Force | Age > 16
In terms of in labor force | age > 16, the demographic groups most similar to Filipinos are Bangladeshi (65.9%, a difference of 0.010%), Immigrants from Chile (65.9%, a difference of 0.030%), Immigrants from Cambodia (66.0%, a difference of 0.050%), Immigrants from Uruguay (66.0%, a difference of 0.050%), and Immigrants from Australia (65.9%, a difference of 0.050%).
| Demographics | Rating | Rank | In Labor Force | Age > 16 |
| Chileans | 99.2 /100 | #90 | Exceptional 66.0% |
| Iranians | 99.2 /100 | #91 | Exceptional 66.0% |
| Aleuts | 99.1 /100 | #92 | Exceptional 66.0% |
| Immigrants | South America | 99.1 /100 | #93 | Exceptional 66.0% |
| Immigrants | Cambodia | 99.1 /100 | #94 | Exceptional 66.0% |
| Immigrants | Uruguay | 99.1 /100 | #95 | Exceptional 66.0% |
| Bangladeshis | 98.9 /100 | #96 | Exceptional 65.9% |
| Filipinos | 98.9 /100 | #97 | Exceptional 65.9% |
| Immigrants | Chile | 98.7 /100 | #98 | Exceptional 65.9% |
| Immigrants | Australia | 98.7 /100 | #99 | Exceptional 65.9% |
| Okinawans | 98.7 /100 | #100 | Exceptional 65.9% |
| Immigrants | Colombia | 98.6 /100 | #101 | Exceptional 65.9% |
| Uruguayans | 98.6 /100 | #102 | Exceptional 65.9% |
| Immigrants | South Eastern Asia | 98.5 /100 | #103 | Exceptional 65.9% |
| Palestinians | 98.5 /100 | #104 | Exceptional 65.9% |