Nicaraguan vs Filipino In Labor Force | Age > 16
COMPARE
Nicaraguan
Filipino
In Labor Force | Age > 16
In Labor Force | Age > 16 Comparison
Nicaraguans
Filipinos
65.1%
IN LABOR FORCE | AGE > 16
49.7/ 100
METRIC RATING
175th/ 347
METRIC RANK
65.9%
IN LABOR FORCE | AGE > 16
98.9/ 100
METRIC RATING
97th/ 347
METRIC RANK
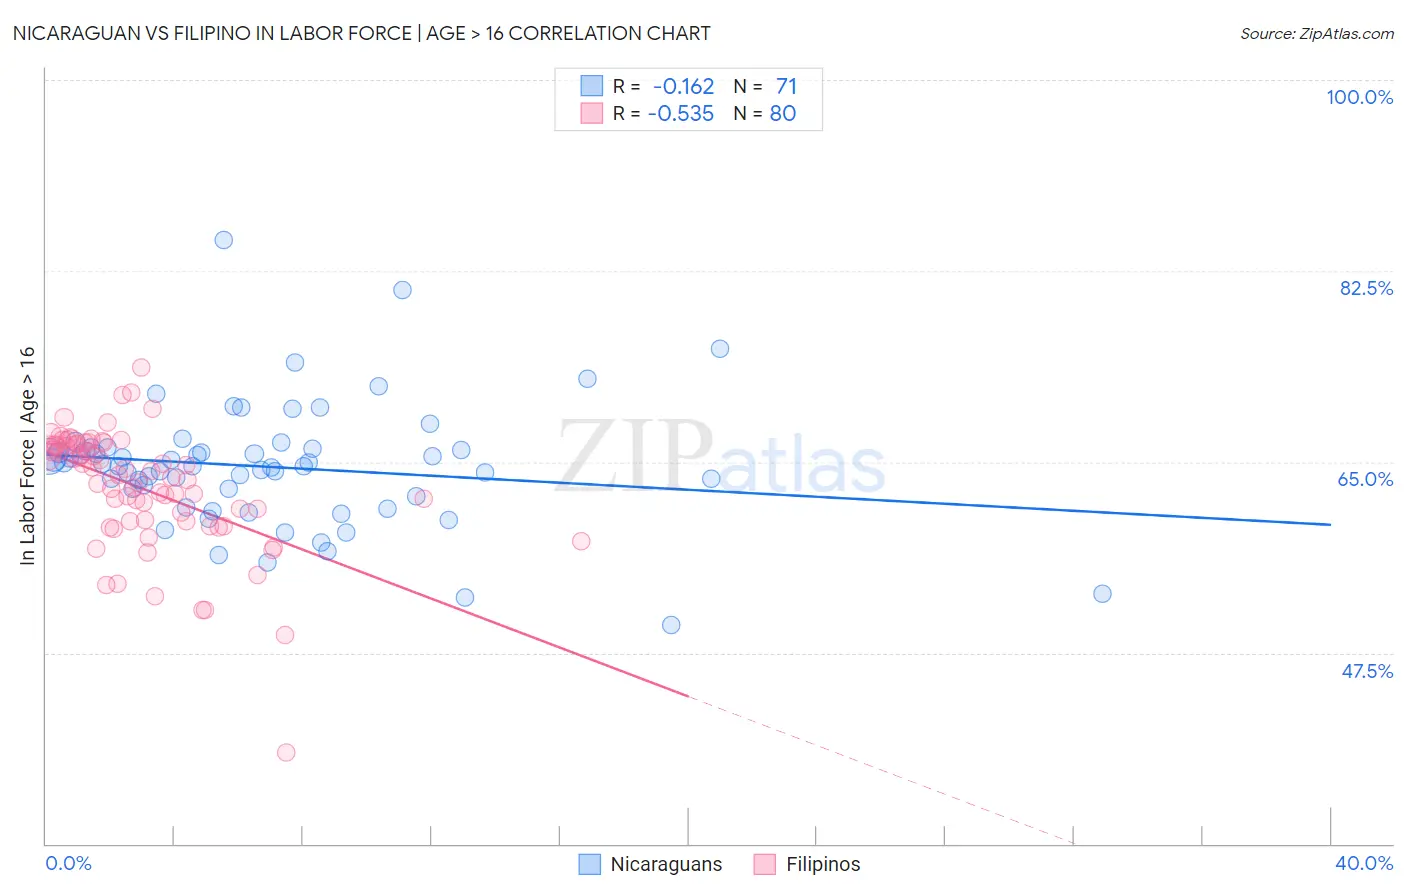
Nicaraguan vs Filipino In Labor Force | Age > 16 Correlation Chart
The statistical analysis conducted on geographies consisting of 285,718,835 people shows a poor negative correlation between the proportion of Nicaraguans and labor force participation rate among population ages 16 and over in the United States with a correlation coefficient (R) of -0.162 and weighted average of 65.1%. Similarly, the statistical analysis conducted on geographies consisting of 254,350,604 people shows a substantial negative correlation between the proportion of Filipinos and labor force participation rate among population ages 16 and over in the United States with a correlation coefficient (R) of -0.535 and weighted average of 65.9%, a difference of 1.3%.
In Labor Force | Age > 16 Correlation Summary
| Measurement | Nicaraguan | Filipino |
| Minimum | 50.0% | 38.4% |
| Maximum | 85.4% | 73.7% |
| Range | 35.4% | 35.3% |
| Mean | 64.6% | 62.6% |
| Median | 64.6% | 63.7% |
| Interquartile 25% (IQ1) | 61.9% | 59.6% |
| Interquartile 75% (IQ3) | 66.2% | 66.6% |
| Interquartile Range (IQR) | 4.3% | 7.0% |
| Standard Deviation (Sample) | 5.7% | 5.6% |
| Standard Deviation (Population) | 5.6% | 5.5% |
Similar Demographics by In Labor Force | Age > 16
Demographics Similar to Nicaraguans by In Labor Force | Age > 16
In terms of in labor force | age > 16, the demographic groups most similar to Nicaraguans are Macedonian (65.1%, a difference of 0.0%), Swedish (65.1%, a difference of 0.030%), Immigrants from Ukraine (65.1%, a difference of 0.040%), Eastern European (65.1%, a difference of 0.040%), and Trinidadian and Tobagonian (65.1%, a difference of 0.050%).
| Demographics | Rating | Rank | In Labor Force | Age > 16 |
| Serbians | 63.5 /100 | #168 | Good 65.2% |
| Arabs | 62.4 /100 | #169 | Good 65.2% |
| Immigrants | Israel | 61.7 /100 | #170 | Good 65.2% |
| Israelis | 61.6 /100 | #171 | Good 65.2% |
| Immigrants | Sweden | 61.3 /100 | #172 | Good 65.2% |
| Immigrants | Ukraine | 53.7 /100 | #173 | Average 65.1% |
| Macedonians | 50.0 /100 | #174 | Average 65.1% |
| Nicaraguans | 49.7 /100 | #175 | Average 65.1% |
| Swedes | 47.4 /100 | #176 | Average 65.1% |
| Eastern Europeans | 46.2 /100 | #177 | Average 65.1% |
| Trinidadians and Tobagonians | 45.2 /100 | #178 | Average 65.1% |
| Immigrants | Haiti | 43.3 /100 | #179 | Average 65.1% |
| Immigrants | Latvia | 42.9 /100 | #180 | Average 65.1% |
| Immigrants | Panama | 42.4 /100 | #181 | Average 65.1% |
| Immigrants | Nicaragua | 41.1 /100 | #182 | Average 65.1% |
Demographics Similar to Filipinos by In Labor Force | Age > 16
In terms of in labor force | age > 16, the demographic groups most similar to Filipinos are Bangladeshi (65.9%, a difference of 0.010%), Immigrants from Chile (65.9%, a difference of 0.030%), Immigrants from Cambodia (66.0%, a difference of 0.050%), Immigrants from Uruguay (66.0%, a difference of 0.050%), and Immigrants from Australia (65.9%, a difference of 0.050%).
| Demographics | Rating | Rank | In Labor Force | Age > 16 |
| Chileans | 99.2 /100 | #90 | Exceptional 66.0% |
| Iranians | 99.2 /100 | #91 | Exceptional 66.0% |
| Aleuts | 99.1 /100 | #92 | Exceptional 66.0% |
| Immigrants | South America | 99.1 /100 | #93 | Exceptional 66.0% |
| Immigrants | Cambodia | 99.1 /100 | #94 | Exceptional 66.0% |
| Immigrants | Uruguay | 99.1 /100 | #95 | Exceptional 66.0% |
| Bangladeshis | 98.9 /100 | #96 | Exceptional 65.9% |
| Filipinos | 98.9 /100 | #97 | Exceptional 65.9% |
| Immigrants | Chile | 98.7 /100 | #98 | Exceptional 65.9% |
| Immigrants | Australia | 98.7 /100 | #99 | Exceptional 65.9% |
| Okinawans | 98.7 /100 | #100 | Exceptional 65.9% |
| Immigrants | Colombia | 98.6 /100 | #101 | Exceptional 65.9% |
| Uruguayans | 98.6 /100 | #102 | Exceptional 65.9% |
| Immigrants | South Eastern Asia | 98.5 /100 | #103 | Exceptional 65.9% |
| Palestinians | 98.5 /100 | #104 | Exceptional 65.9% |