Northern European vs Filipino In Labor Force | Age > 16
COMPARE
Northern European
Filipino
In Labor Force | Age > 16
In Labor Force | Age > 16 Comparison
Northern Europeans
Filipinos
64.7%
IN LABOR FORCE | AGE > 16
8.2/ 100
METRIC RATING
228th/ 347
METRIC RANK
65.9%
IN LABOR FORCE | AGE > 16
98.9/ 100
METRIC RATING
97th/ 347
METRIC RANK
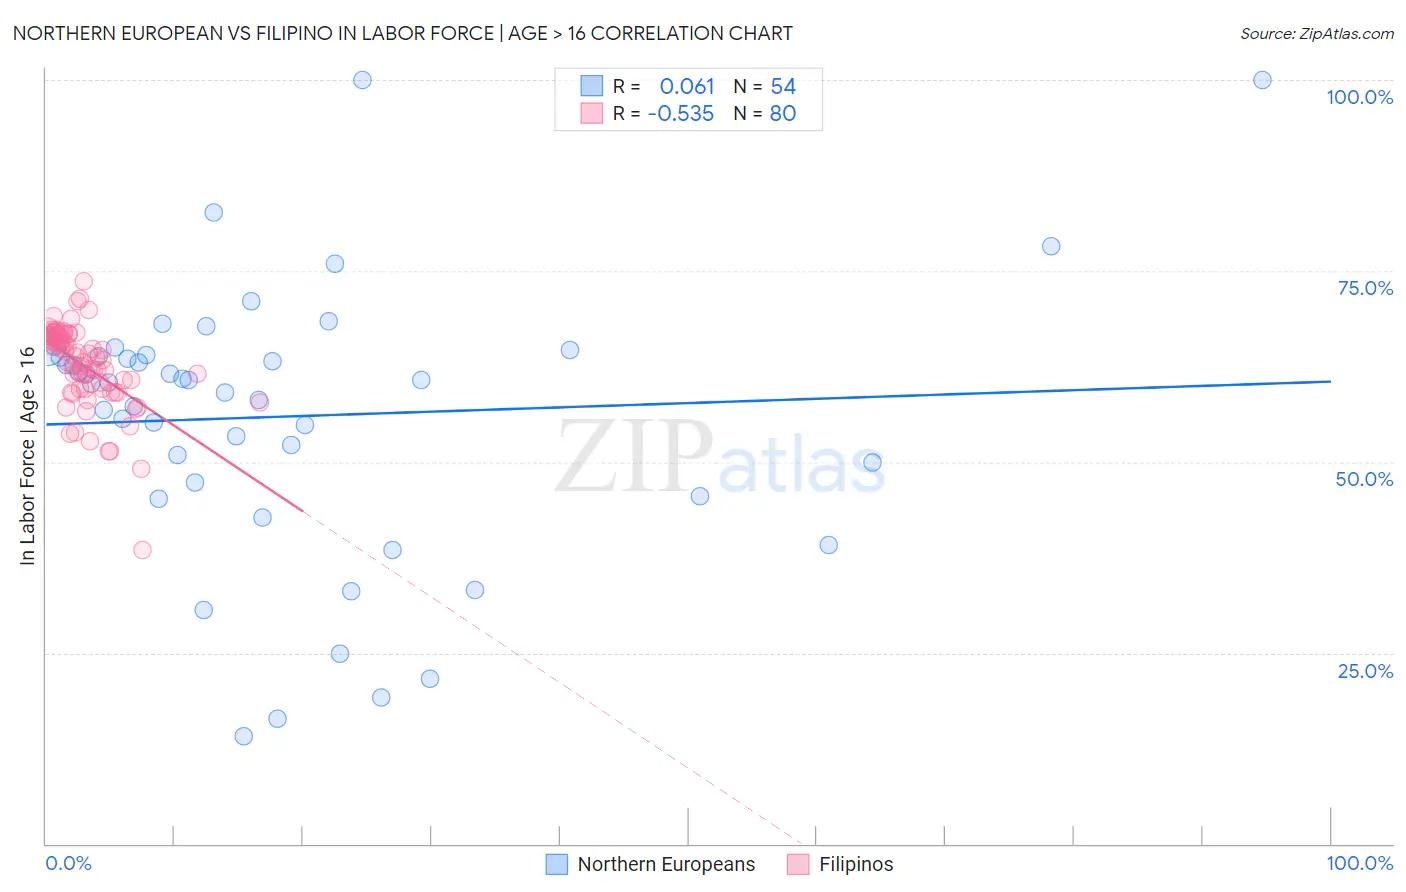
Northern European vs Filipino In Labor Force | Age > 16 Correlation Chart
The statistical analysis conducted on geographies consisting of 406,102,680 people shows a slight positive correlation between the proportion of Northern Europeans and labor force participation rate among population ages 16 and over in the United States with a correlation coefficient (R) of 0.061 and weighted average of 64.7%. Similarly, the statistical analysis conducted on geographies consisting of 254,350,604 people shows a substantial negative correlation between the proportion of Filipinos and labor force participation rate among population ages 16 and over in the United States with a correlation coefficient (R) of -0.535 and weighted average of 65.9%, a difference of 1.9%.
In Labor Force | Age > 16 Correlation Summary
| Measurement | Northern European | Filipino |
| Minimum | 14.1% | 38.4% |
| Maximum | 100.0% | 73.7% |
| Range | 85.9% | 35.3% |
| Mean | 55.9% | 62.6% |
| Median | 60.6% | 63.7% |
| Interquartile 25% (IQ1) | 47.3% | 59.6% |
| Interquartile 75% (IQ3) | 63.9% | 66.6% |
| Interquartile Range (IQR) | 16.6% | 7.0% |
| Standard Deviation (Sample) | 17.8% | 5.6% |
| Standard Deviation (Population) | 17.6% | 5.5% |
Similar Demographics by In Labor Force | Age > 16
Demographics Similar to Northern Europeans by In Labor Force | Age > 16
In terms of in labor force | age > 16, the demographic groups most similar to Northern Europeans are European (64.7%, a difference of 0.0%), Polish (64.7%, a difference of 0.0%), Immigrants from Jamaica (64.7%, a difference of 0.020%), Croatian (64.7%, a difference of 0.020%), and Hawaiian (64.7%, a difference of 0.040%).
| Demographics | Rating | Rank | In Labor Force | Age > 16 |
| Immigrants | Micronesia | 9.6 /100 | #221 | Tragic 64.7% |
| Hawaiians | 9.3 /100 | #222 | Tragic 64.7% |
| Immigrants | Belize | 9.2 /100 | #223 | Tragic 64.7% |
| Immigrants | Jamaica | 8.8 /100 | #224 | Tragic 64.7% |
| Croatians | 8.8 /100 | #225 | Tragic 64.7% |
| Europeans | 8.3 /100 | #226 | Tragic 64.7% |
| Poles | 8.3 /100 | #227 | Tragic 64.7% |
| Northern Europeans | 8.2 /100 | #228 | Tragic 64.7% |
| British | 7.3 /100 | #229 | Tragic 64.7% |
| Chinese | 7.3 /100 | #230 | Tragic 64.7% |
| Immigrants | Northern Europe | 7.2 /100 | #231 | Tragic 64.7% |
| Africans | 5.8 /100 | #232 | Tragic 64.6% |
| Slavs | 4.9 /100 | #233 | Tragic 64.6% |
| Vietnamese | 4.7 /100 | #234 | Tragic 64.6% |
| Austrians | 4.6 /100 | #235 | Tragic 64.6% |
Demographics Similar to Filipinos by In Labor Force | Age > 16
In terms of in labor force | age > 16, the demographic groups most similar to Filipinos are Bangladeshi (65.9%, a difference of 0.010%), Immigrants from Chile (65.9%, a difference of 0.030%), Immigrants from Cambodia (66.0%, a difference of 0.050%), Immigrants from Uruguay (66.0%, a difference of 0.050%), and Immigrants from Australia (65.9%, a difference of 0.050%).
| Demographics | Rating | Rank | In Labor Force | Age > 16 |
| Chileans | 99.2 /100 | #90 | Exceptional 66.0% |
| Iranians | 99.2 /100 | #91 | Exceptional 66.0% |
| Aleuts | 99.1 /100 | #92 | Exceptional 66.0% |
| Immigrants | South America | 99.1 /100 | #93 | Exceptional 66.0% |
| Immigrants | Cambodia | 99.1 /100 | #94 | Exceptional 66.0% |
| Immigrants | Uruguay | 99.1 /100 | #95 | Exceptional 66.0% |
| Bangladeshis | 98.9 /100 | #96 | Exceptional 65.9% |
| Filipinos | 98.9 /100 | #97 | Exceptional 65.9% |
| Immigrants | Chile | 98.7 /100 | #98 | Exceptional 65.9% |
| Immigrants | Australia | 98.7 /100 | #99 | Exceptional 65.9% |
| Okinawans | 98.7 /100 | #100 | Exceptional 65.9% |
| Immigrants | Colombia | 98.6 /100 | #101 | Exceptional 65.9% |
| Uruguayans | 98.6 /100 | #102 | Exceptional 65.9% |
| Immigrants | South Eastern Asia | 98.5 /100 | #103 | Exceptional 65.9% |
| Palestinians | 98.5 /100 | #104 | Exceptional 65.9% |