Immigrants from Norway vs Senegalese In Labor Force | Age 20-64
COMPARE
Immigrants from Norway
Senegalese
In Labor Force | Age 20-64
In Labor Force | Age 20-64 Comparison
Immigrants from Norway
Senegalese
79.2%
IN LABOR FORCE | AGE 20-64
12.0/ 100
METRIC RATING
215th/ 347
METRIC RANK
79.7%
IN LABOR FORCE | AGE 20-64
69.1/ 100
METRIC RATING
156th/ 347
METRIC RANK
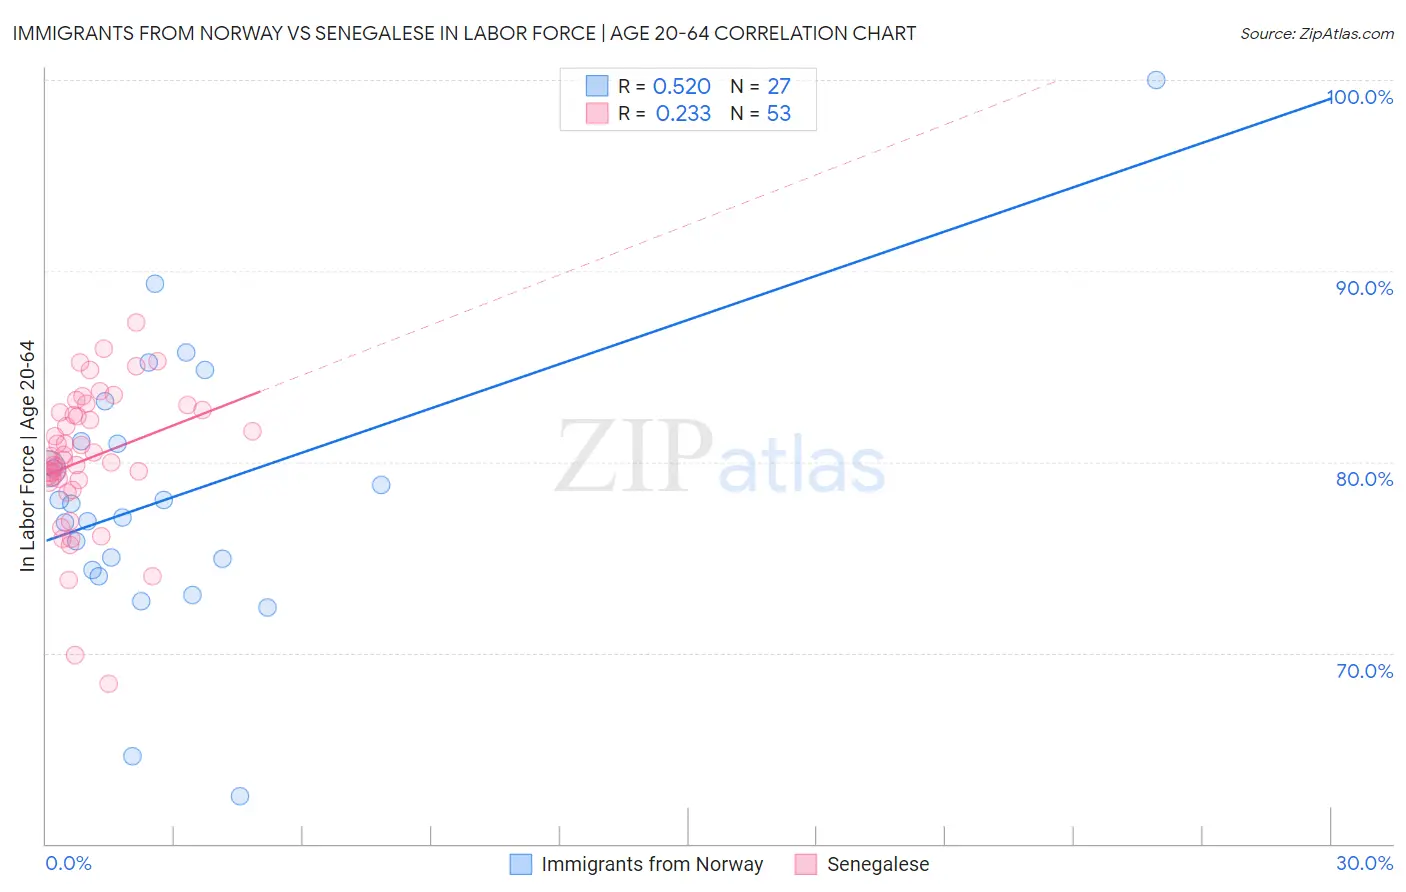
Immigrants from Norway vs Senegalese In Labor Force | Age 20-64 Correlation Chart
The statistical analysis conducted on geographies consisting of 116,716,898 people shows a substantial positive correlation between the proportion of Immigrants from Norway and labor force participation rate among population between the ages 20 and 64 in the United States with a correlation coefficient (R) of 0.520 and weighted average of 79.2%. Similarly, the statistical analysis conducted on geographies consisting of 78,141,567 people shows a weak positive correlation between the proportion of Senegalese and labor force participation rate among population between the ages 20 and 64 in the United States with a correlation coefficient (R) of 0.233 and weighted average of 79.7%, a difference of 0.56%.
In Labor Force | Age 20-64 Correlation Summary
| Measurement | Immigrants from Norway | Senegalese |
| Minimum | 62.5% | 68.4% |
| Maximum | 100.0% | 87.3% |
| Range | 37.5% | 18.9% |
| Mean | 78.2% | 80.2% |
| Median | 77.8% | 80.1% |
| Interquartile 25% (IQ1) | 74.3% | 79.0% |
| Interquartile 75% (IQ3) | 81.1% | 82.7% |
| Interquartile Range (IQR) | 6.7% | 3.6% |
| Standard Deviation (Sample) | 7.3% | 3.7% |
| Standard Deviation (Population) | 7.1% | 3.7% |
Similar Demographics by In Labor Force | Age 20-64
Demographics Similar to Immigrants from Norway by In Labor Force | Age 20-64
In terms of in labor force | age 20-64, the demographic groups most similar to Immigrants from Norway are Immigrants from Armenia (79.2%, a difference of 0.0%), Arab (79.2%, a difference of 0.010%), Irish (79.3%, a difference of 0.020%), Immigrants from Portugal (79.3%, a difference of 0.020%), and Immigrants from Western Asia (79.2%, a difference of 0.020%).
| Demographics | Rating | Rank | In Labor Force | Age 20-64 |
| British | 16.5 /100 | #208 | Poor 79.3% |
| Bangladeshis | 16.4 /100 | #209 | Poor 79.3% |
| Haitians | 16.1 /100 | #210 | Poor 79.3% |
| Europeans | 15.3 /100 | #211 | Poor 79.3% |
| Irish | 13.2 /100 | #212 | Poor 79.3% |
| Immigrants | Portugal | 12.8 /100 | #213 | Poor 79.3% |
| Immigrants | Armenia | 12.2 /100 | #214 | Poor 79.2% |
| Immigrants | Norway | 12.0 /100 | #215 | Poor 79.2% |
| Arabs | 11.4 /100 | #216 | Poor 79.2% |
| Immigrants | Western Asia | 11.0 /100 | #217 | Poor 79.2% |
| Immigrants | England | 9.3 /100 | #218 | Tragic 79.2% |
| French Canadians | 8.4 /100 | #219 | Tragic 79.2% |
| Immigrants | Immigrants | 7.7 /100 | #220 | Tragic 79.2% |
| Hungarians | 7.2 /100 | #221 | Tragic 79.2% |
| Immigrants | Panama | 6.9 /100 | #222 | Tragic 79.1% |
Demographics Similar to Senegalese by In Labor Force | Age 20-64
In terms of in labor force | age 20-64, the demographic groups most similar to Senegalese are Immigrants from Kazakhstan (79.7%, a difference of 0.0%), New Zealander (79.7%, a difference of 0.0%), Immigrants from South Africa (79.7%, a difference of 0.0%), Immigrants from China (79.7%, a difference of 0.0%), and Austrian (79.7%, a difference of 0.010%).
| Demographics | Rating | Rank | In Labor Force | Age 20-64 |
| Icelanders | 75.1 /100 | #149 | Good 79.7% |
| Costa Ricans | 72.4 /100 | #150 | Good 79.7% |
| Scandinavians | 72.0 /100 | #151 | Good 79.7% |
| Immigrants | Northern Europe | 72.0 /100 | #152 | Good 79.7% |
| Immigrants | Kazakhstan | 69.5 /100 | #153 | Good 79.7% |
| New Zealanders | 69.4 /100 | #154 | Good 79.7% |
| Immigrants | South Africa | 69.2 /100 | #155 | Good 79.7% |
| Senegalese | 69.1 /100 | #156 | Good 79.7% |
| Immigrants | China | 69.1 /100 | #157 | Good 79.7% |
| Austrians | 67.6 /100 | #158 | Good 79.7% |
| Immigrants | Cuba | 66.7 /100 | #159 | Good 79.7% |
| Moroccans | 66.7 /100 | #160 | Good 79.7% |
| South Africans | 66.2 /100 | #161 | Good 79.7% |
| Germans | 65.2 /100 | #162 | Good 79.7% |
| Immigrants | Costa Rica | 64.6 /100 | #163 | Good 79.7% |