Peruvian vs Scottish In Labor Force | Age 20-64
COMPARE
Peruvian
Scottish
In Labor Force | Age 20-64
In Labor Force | Age 20-64 Comparison
Peruvians
Scottish
80.3%
IN LABOR FORCE | AGE 20-64
99.1/ 100
METRIC RATING
54th/ 347
METRIC RANK
78.9%
IN LABOR FORCE | AGE 20-64
1.3/ 100
METRIC RATING
245th/ 347
METRIC RANK
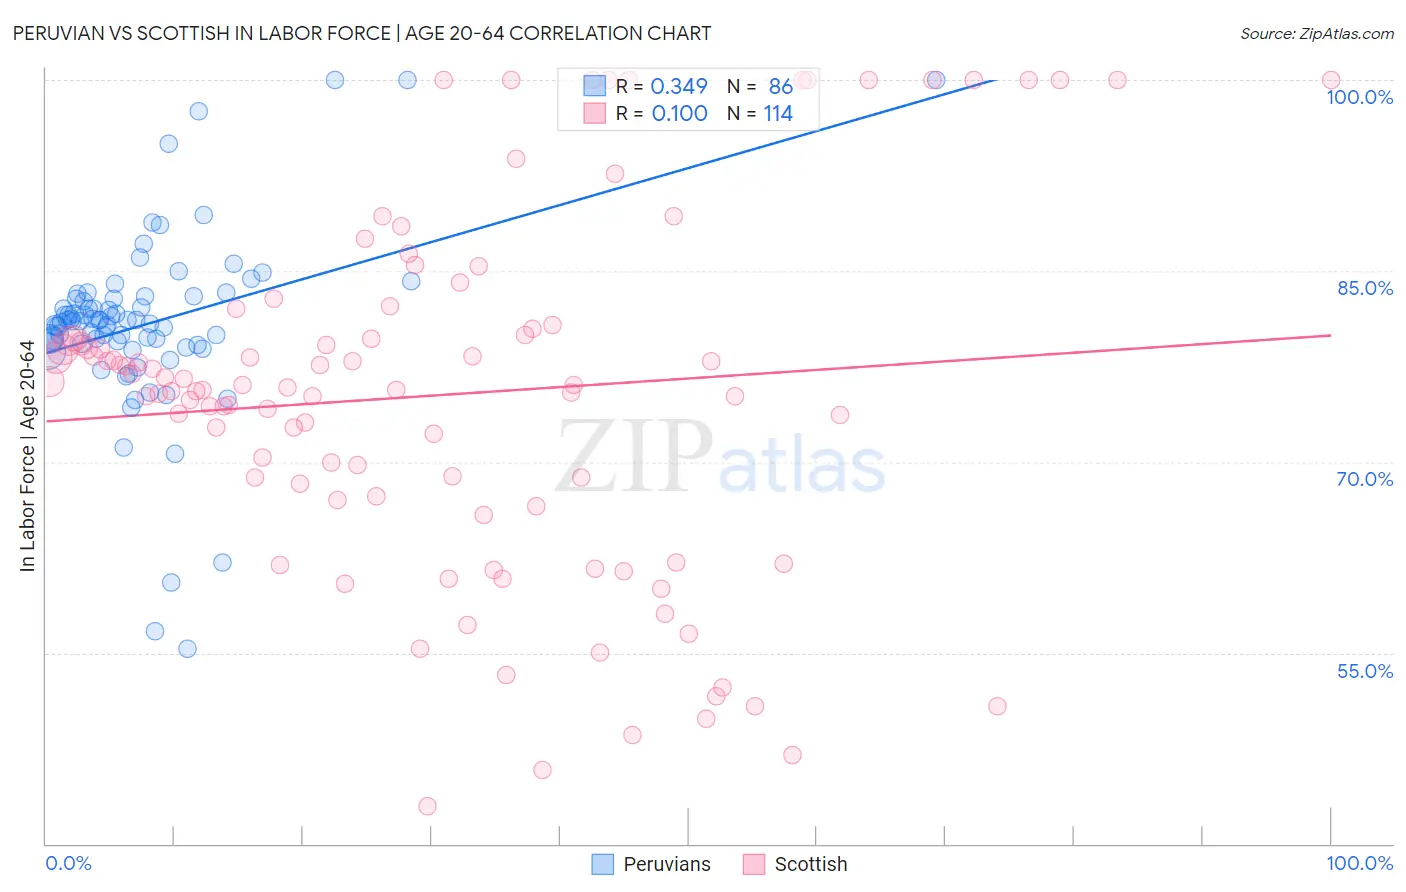
Peruvian vs Scottish In Labor Force | Age 20-64 Correlation Chart
The statistical analysis conducted on geographies consisting of 363,253,233 people shows a mild positive correlation between the proportion of Peruvians and labor force participation rate among population between the ages 20 and 64 in the United States with a correlation coefficient (R) of 0.349 and weighted average of 80.3%. Similarly, the statistical analysis conducted on geographies consisting of 567,150,822 people shows a poor positive correlation between the proportion of Scottish and labor force participation rate among population between the ages 20 and 64 in the United States with a correlation coefficient (R) of 0.100 and weighted average of 78.9%, a difference of 1.8%.
In Labor Force | Age 20-64 Correlation Summary
| Measurement | Peruvian | Scottish |
| Minimum | 55.3% | 42.9% |
| Maximum | 100.0% | 100.0% |
| Range | 44.7% | 57.1% |
| Mean | 80.8% | 75.3% |
| Median | 81.1% | 75.9% |
| Interquartile 25% (IQ1) | 79.2% | 67.3% |
| Interquartile 75% (IQ3) | 82.8% | 80.4% |
| Interquartile Range (IQR) | 3.6% | 13.2% |
| Standard Deviation (Sample) | 7.2% | 13.9% |
| Standard Deviation (Population) | 7.2% | 13.9% |
Similar Demographics by In Labor Force | Age 20-64
Demographics Similar to Peruvians by In Labor Force | Age 20-64
In terms of in labor force | age 20-64, the demographic groups most similar to Peruvians are Immigrants from Peru (80.3%, a difference of 0.010%), Immigrants from Cabo Verde (80.3%, a difference of 0.020%), Turkish (80.3%, a difference of 0.030%), Immigrants from Sri Lanka (80.4%, a difference of 0.040%), and Immigrants from Northern Africa (80.3%, a difference of 0.040%).
| Demographics | Rating | Rank | In Labor Force | Age 20-64 |
| Immigrants | Africa | 99.6 /100 | #47 | Exceptional 80.4% |
| Immigrants | Hong Kong | 99.5 /100 | #48 | Exceptional 80.4% |
| Immigrants | Greece | 99.4 /100 | #49 | Exceptional 80.4% |
| Immigrants | Sudan | 99.4 /100 | #50 | Exceptional 80.4% |
| Immigrants | Sri Lanka | 99.3 /100 | #51 | Exceptional 80.4% |
| Turks | 99.2 /100 | #52 | Exceptional 80.3% |
| Immigrants | Peru | 99.2 /100 | #53 | Exceptional 80.3% |
| Peruvians | 99.1 /100 | #54 | Exceptional 80.3% |
| Immigrants | Cabo Verde | 99.0 /100 | #55 | Exceptional 80.3% |
| Immigrants | Northern Africa | 99.0 /100 | #56 | Exceptional 80.3% |
| Afghans | 98.9 /100 | #57 | Exceptional 80.3% |
| Serbians | 98.9 /100 | #58 | Exceptional 80.3% |
| Swedes | 98.9 /100 | #59 | Exceptional 80.3% |
| Tongans | 98.8 /100 | #60 | Exceptional 80.3% |
| Burmese | 98.8 /100 | #61 | Exceptional 80.3% |
Demographics Similar to Scottish by In Labor Force | Age 20-64
In terms of in labor force | age 20-64, the demographic groups most similar to Scottish are Immigrants from Trinidad and Tobago (78.8%, a difference of 0.030%), French (78.9%, a difference of 0.040%), Immigrants from Germany (78.8%, a difference of 0.040%), Immigrants from Caribbean (78.8%, a difference of 0.050%), and Immigrants from West Indies (78.9%, a difference of 0.070%).
| Demographics | Rating | Rank | In Labor Force | Age 20-64 |
| Immigrants | Jamaica | 2.6 /100 | #238 | Tragic 79.0% |
| Welsh | 2.4 /100 | #239 | Tragic 79.0% |
| Trinidadians and Tobagonians | 2.3 /100 | #240 | Tragic 79.0% |
| Jamaicans | 2.0 /100 | #241 | Tragic 78.9% |
| Immigrants | Micronesia | 1.9 /100 | #242 | Tragic 78.9% |
| Immigrants | West Indies | 1.7 /100 | #243 | Tragic 78.9% |
| French | 1.5 /100 | #244 | Tragic 78.9% |
| Scottish | 1.3 /100 | #245 | Tragic 78.9% |
| Immigrants | Trinidad and Tobago | 1.1 /100 | #246 | Tragic 78.8% |
| Immigrants | Germany | 1.0 /100 | #247 | Tragic 78.8% |
| Immigrants | Caribbean | 1.0 /100 | #248 | Tragic 78.8% |
| English | 0.9 /100 | #249 | Tragic 78.8% |
| Hondurans | 0.8 /100 | #250 | Tragic 78.8% |
| Barbadians | 0.7 /100 | #251 | Tragic 78.8% |
| Immigrants | Honduras | 0.6 /100 | #252 | Tragic 78.7% |