Immigrants from Zaire vs Scottish In Labor Force | Age 20-64
COMPARE
Immigrants from Zaire
Scottish
In Labor Force | Age 20-64
In Labor Force | Age 20-64 Comparison
Immigrants from Zaire
Scottish
79.9%
IN LABOR FORCE | AGE 20-64
88.6/ 100
METRIC RATING
130th/ 347
METRIC RANK
78.9%
IN LABOR FORCE | AGE 20-64
1.3/ 100
METRIC RATING
245th/ 347
METRIC RANK
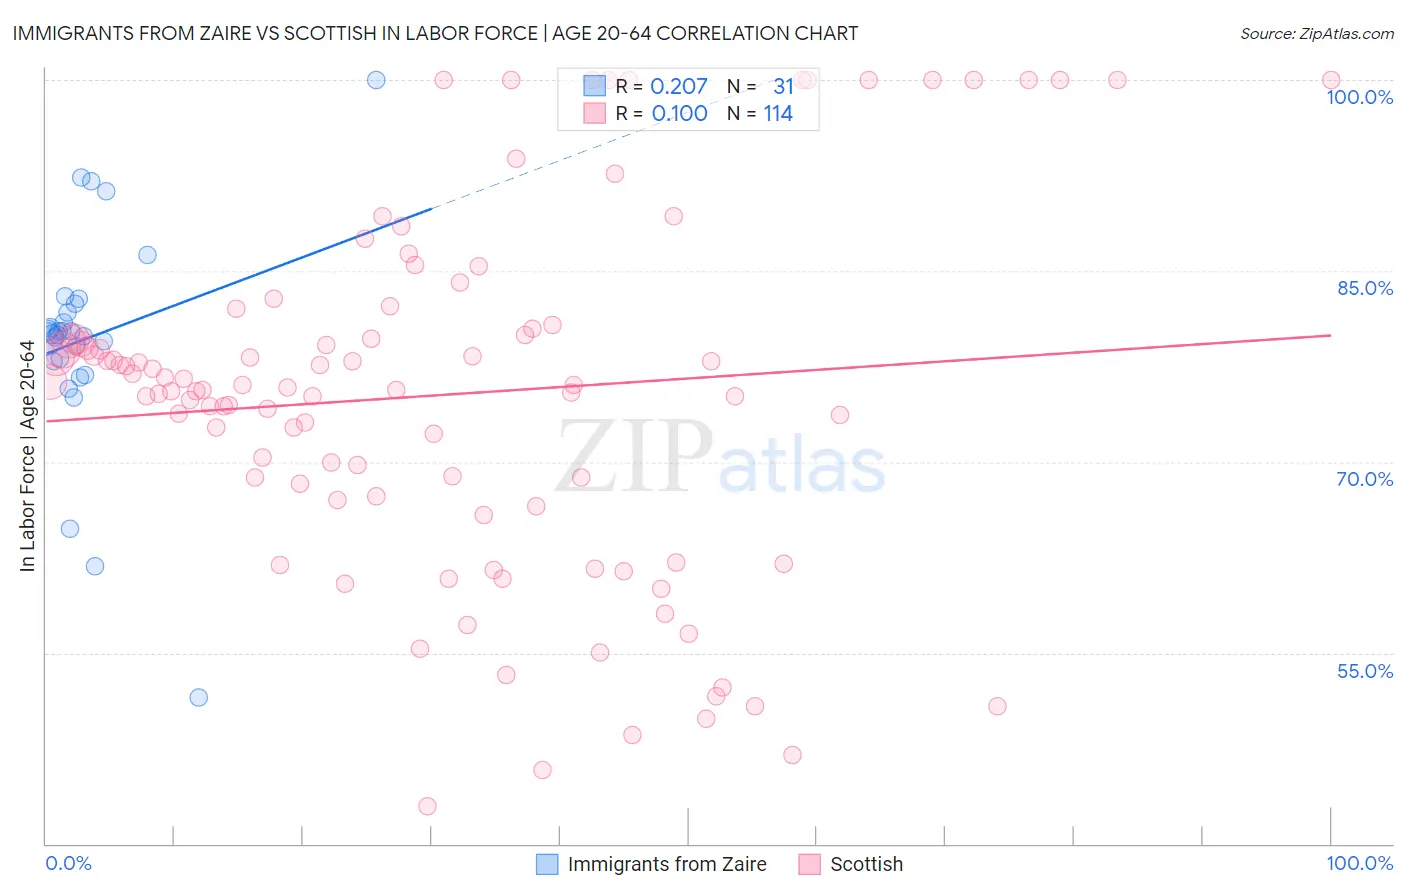
Immigrants from Zaire vs Scottish In Labor Force | Age 20-64 Correlation Chart
The statistical analysis conducted on geographies consisting of 107,255,436 people shows a weak positive correlation between the proportion of Immigrants from Zaire and labor force participation rate among population between the ages 20 and 64 in the United States with a correlation coefficient (R) of 0.207 and weighted average of 79.9%. Similarly, the statistical analysis conducted on geographies consisting of 567,150,822 people shows a poor positive correlation between the proportion of Scottish and labor force participation rate among population between the ages 20 and 64 in the United States with a correlation coefficient (R) of 0.100 and weighted average of 78.9%, a difference of 1.3%.
In Labor Force | Age 20-64 Correlation Summary
| Measurement | Immigrants from Zaire | Scottish |
| Minimum | 51.5% | 42.9% |
| Maximum | 100.0% | 100.0% |
| Range | 48.5% | 57.1% |
| Mean | 79.7% | 75.3% |
| Median | 80.0% | 75.9% |
| Interquartile 25% (IQ1) | 77.9% | 67.3% |
| Interquartile 75% (IQ3) | 82.4% | 80.4% |
| Interquartile Range (IQR) | 4.5% | 13.2% |
| Standard Deviation (Sample) | 8.8% | 13.9% |
| Standard Deviation (Population) | 8.7% | 13.9% |
Similar Demographics by In Labor Force | Age 20-64
Demographics Similar to Immigrants from Zaire by In Labor Force | Age 20-64
In terms of in labor force | age 20-64, the demographic groups most similar to Immigrants from Zaire are Italian (79.9%, a difference of 0.010%), Immigrants from Iran (79.9%, a difference of 0.010%), Immigrants from Czechoslovakia (79.9%, a difference of 0.020%), Immigrants from Eastern Asia (79.9%, a difference of 0.020%), and Indian (Asian) (79.9%, a difference of 0.020%).
| Demographics | Rating | Rank | In Labor Force | Age 20-64 |
| Immigrants | Russia | 91.8 /100 | #123 | Exceptional 79.9% |
| Immigrants | Europe | 91.6 /100 | #124 | Exceptional 79.9% |
| Danes | 91.5 /100 | #125 | Exceptional 79.9% |
| Immigrants | France | 90.7 /100 | #126 | Exceptional 79.9% |
| Immigrants | Czechoslovakia | 89.7 /100 | #127 | Excellent 79.9% |
| Immigrants | Eastern Asia | 89.4 /100 | #128 | Excellent 79.9% |
| Italians | 88.9 /100 | #129 | Excellent 79.9% |
| Immigrants | Zaire | 88.6 /100 | #130 | Excellent 79.9% |
| Immigrants | Iran | 88.3 /100 | #131 | Excellent 79.9% |
| Indians (Asian) | 87.7 /100 | #132 | Excellent 79.9% |
| South American Indians | 87.6 /100 | #133 | Excellent 79.9% |
| Belgians | 87.4 /100 | #134 | Excellent 79.9% |
| Ukrainians | 86.8 /100 | #135 | Excellent 79.9% |
| Immigrants | Singapore | 86.7 /100 | #136 | Excellent 79.9% |
| Immigrants | Ukraine | 86.5 /100 | #137 | Excellent 79.9% |
Demographics Similar to Scottish by In Labor Force | Age 20-64
In terms of in labor force | age 20-64, the demographic groups most similar to Scottish are Immigrants from Trinidad and Tobago (78.8%, a difference of 0.030%), French (78.9%, a difference of 0.040%), Immigrants from Germany (78.8%, a difference of 0.040%), Immigrants from Caribbean (78.8%, a difference of 0.050%), and Immigrants from West Indies (78.9%, a difference of 0.070%).
| Demographics | Rating | Rank | In Labor Force | Age 20-64 |
| Immigrants | Jamaica | 2.6 /100 | #238 | Tragic 79.0% |
| Welsh | 2.4 /100 | #239 | Tragic 79.0% |
| Trinidadians and Tobagonians | 2.3 /100 | #240 | Tragic 79.0% |
| Jamaicans | 2.0 /100 | #241 | Tragic 78.9% |
| Immigrants | Micronesia | 1.9 /100 | #242 | Tragic 78.9% |
| Immigrants | West Indies | 1.7 /100 | #243 | Tragic 78.9% |
| French | 1.5 /100 | #244 | Tragic 78.9% |
| Scottish | 1.3 /100 | #245 | Tragic 78.9% |
| Immigrants | Trinidad and Tobago | 1.1 /100 | #246 | Tragic 78.8% |
| Immigrants | Germany | 1.0 /100 | #247 | Tragic 78.8% |
| Immigrants | Caribbean | 1.0 /100 | #248 | Tragic 78.8% |
| English | 0.9 /100 | #249 | Tragic 78.8% |
| Hondurans | 0.8 /100 | #250 | Tragic 78.8% |
| Barbadians | 0.7 /100 | #251 | Tragic 78.8% |
| Immigrants | Honduras | 0.6 /100 | #252 | Tragic 78.7% |