Immigrants from Norway vs Slovak In Labor Force | Age 20-64
COMPARE
Immigrants from Norway
Slovak
In Labor Force | Age 20-64
In Labor Force | Age 20-64 Comparison
Immigrants from Norway
Slovaks
79.2%
IN LABOR FORCE | AGE 20-64
12.0/ 100
METRIC RATING
215th/ 347
METRIC RANK
79.8%
IN LABOR FORCE | AGE 20-64
79.9/ 100
METRIC RATING
142nd/ 347
METRIC RANK
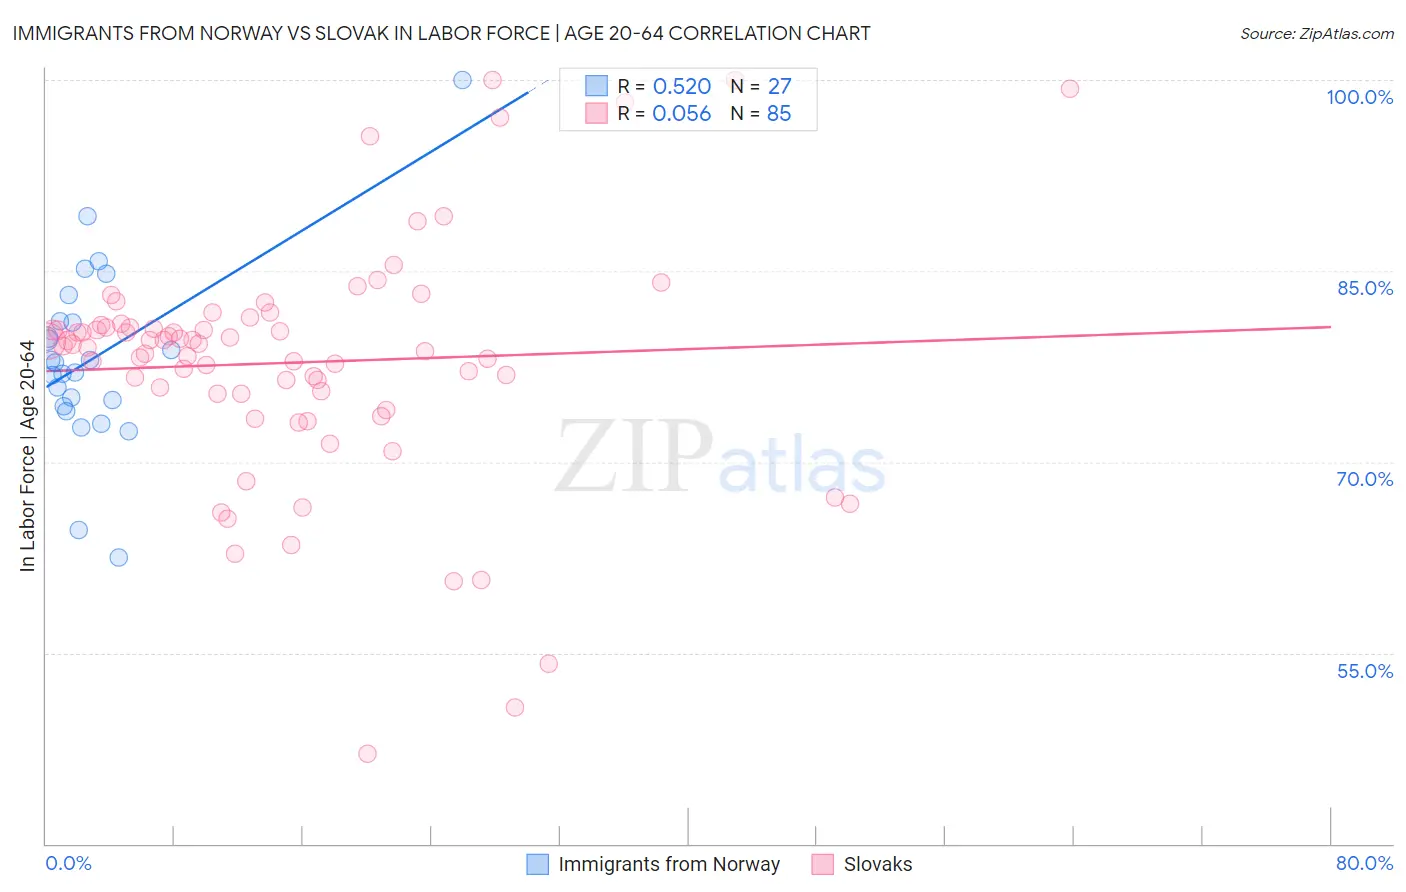
Immigrants from Norway vs Slovak In Labor Force | Age 20-64 Correlation Chart
The statistical analysis conducted on geographies consisting of 116,716,898 people shows a substantial positive correlation between the proportion of Immigrants from Norway and labor force participation rate among population between the ages 20 and 64 in the United States with a correlation coefficient (R) of 0.520 and weighted average of 79.2%. Similarly, the statistical analysis conducted on geographies consisting of 397,893,595 people shows a slight positive correlation between the proportion of Slovaks and labor force participation rate among population between the ages 20 and 64 in the United States with a correlation coefficient (R) of 0.056 and weighted average of 79.8%, a difference of 0.68%.
In Labor Force | Age 20-64 Correlation Summary
| Measurement | Immigrants from Norway | Slovak |
| Minimum | 62.5% | 47.1% |
| Maximum | 100.0% | 100.0% |
| Range | 37.5% | 52.9% |
| Mean | 78.2% | 77.8% |
| Median | 77.8% | 79.2% |
| Interquartile 25% (IQ1) | 74.3% | 75.3% |
| Interquartile 75% (IQ3) | 81.1% | 80.7% |
| Interquartile Range (IQR) | 6.7% | 5.4% |
| Standard Deviation (Sample) | 7.3% | 9.4% |
| Standard Deviation (Population) | 7.1% | 9.4% |
Similar Demographics by In Labor Force | Age 20-64
Demographics Similar to Immigrants from Norway by In Labor Force | Age 20-64
In terms of in labor force | age 20-64, the demographic groups most similar to Immigrants from Norway are Immigrants from Armenia (79.2%, a difference of 0.0%), Arab (79.2%, a difference of 0.010%), Irish (79.3%, a difference of 0.020%), Immigrants from Portugal (79.3%, a difference of 0.020%), and Immigrants from Western Asia (79.2%, a difference of 0.020%).
| Demographics | Rating | Rank | In Labor Force | Age 20-64 |
| British | 16.5 /100 | #208 | Poor 79.3% |
| Bangladeshis | 16.4 /100 | #209 | Poor 79.3% |
| Haitians | 16.1 /100 | #210 | Poor 79.3% |
| Europeans | 15.3 /100 | #211 | Poor 79.3% |
| Irish | 13.2 /100 | #212 | Poor 79.3% |
| Immigrants | Portugal | 12.8 /100 | #213 | Poor 79.3% |
| Immigrants | Armenia | 12.2 /100 | #214 | Poor 79.2% |
| Immigrants | Norway | 12.0 /100 | #215 | Poor 79.2% |
| Arabs | 11.4 /100 | #216 | Poor 79.2% |
| Immigrants | Western Asia | 11.0 /100 | #217 | Poor 79.2% |
| Immigrants | England | 9.3 /100 | #218 | Tragic 79.2% |
| French Canadians | 8.4 /100 | #219 | Tragic 79.2% |
| Immigrants | Immigrants | 7.7 /100 | #220 | Tragic 79.2% |
| Hungarians | 7.2 /100 | #221 | Tragic 79.2% |
| Immigrants | Panama | 6.9 /100 | #222 | Tragic 79.1% |
Demographics Similar to Slovaks by In Labor Force | Age 20-64
In terms of in labor force | age 20-64, the demographic groups most similar to Slovaks are Immigrants from Israel (79.8%, a difference of 0.0%), Immigrants from Sweden (79.8%, a difference of 0.0%), Korean (79.8%, a difference of 0.0%), Immigrants from South Eastern Asia (79.8%, a difference of 0.010%), and Pakistani (79.8%, a difference of 0.010%).
| Demographics | Rating | Rank | In Labor Force | Age 20-64 |
| Ukrainians | 86.8 /100 | #135 | Excellent 79.9% |
| Immigrants | Singapore | 86.7 /100 | #136 | Excellent 79.9% |
| Immigrants | Ukraine | 86.5 /100 | #137 | Excellent 79.9% |
| Immigrants | Nigeria | 86.4 /100 | #138 | Excellent 79.9% |
| Immigrants | Spain | 83.9 /100 | #139 | Excellent 79.8% |
| Immigrants | South Eastern Asia | 80.4 /100 | #140 | Excellent 79.8% |
| Immigrants | Israel | 80.0 /100 | #141 | Good 79.8% |
| Slovaks | 79.9 /100 | #142 | Good 79.8% |
| Immigrants | Sweden | 79.7 /100 | #143 | Good 79.8% |
| Koreans | 79.6 /100 | #144 | Good 79.8% |
| Pakistanis | 79.3 /100 | #145 | Good 79.8% |
| Immigrants | Southern Europe | 78.9 /100 | #146 | Good 79.8% |
| Immigrants | Philippines | 78.0 /100 | #147 | Good 79.8% |
| Romanians | 77.6 /100 | #148 | Good 79.8% |
| Icelanders | 75.1 /100 | #149 | Good 79.7% |