Immigrants from North Macedonia vs Immigrants from Hungary In Labor Force | Age > 16
COMPARE
Immigrants from North Macedonia
Immigrants from Hungary
In Labor Force | Age > 16
In Labor Force | Age > 16 Comparison
Immigrants from North Macedonia
Immigrants from Hungary
65.6%
IN LABOR FORCE | AGE > 16
94.1/ 100
METRIC RATING
132nd/ 347
METRIC RANK
64.5%
IN LABOR FORCE | AGE > 16
3.8/ 100
METRIC RATING
239th/ 347
METRIC RANK
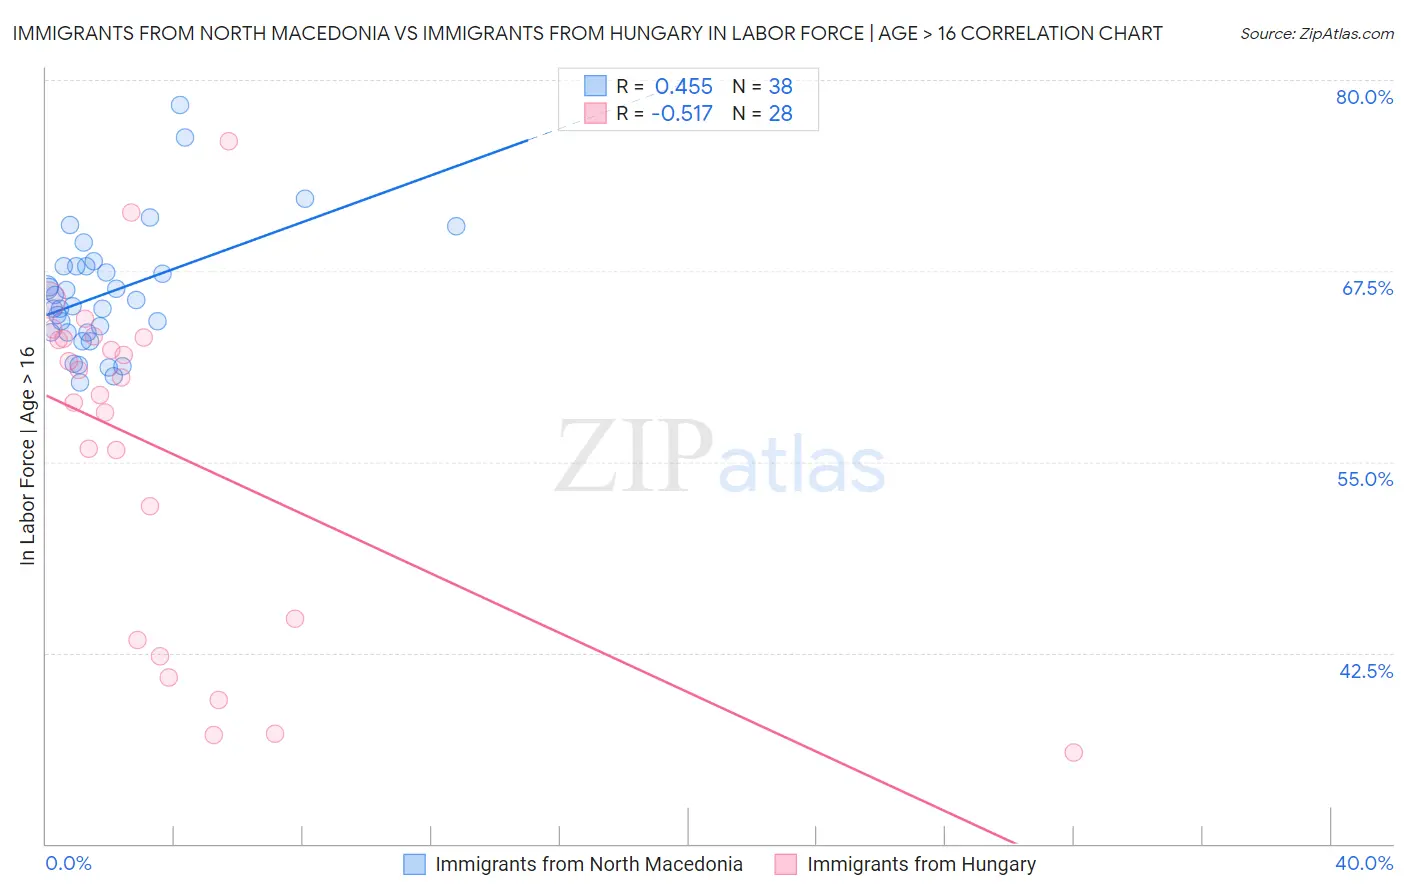
Immigrants from North Macedonia vs Immigrants from Hungary In Labor Force | Age > 16 Correlation Chart
The statistical analysis conducted on geographies consisting of 74,317,186 people shows a moderate positive correlation between the proportion of Immigrants from North Macedonia and labor force participation rate among population ages 16 and over in the United States with a correlation coefficient (R) of 0.455 and weighted average of 65.6%. Similarly, the statistical analysis conducted on geographies consisting of 195,708,395 people shows a substantial negative correlation between the proportion of Immigrants from Hungary and labor force participation rate among population ages 16 and over in the United States with a correlation coefficient (R) of -0.517 and weighted average of 64.5%, a difference of 1.7%.
In Labor Force | Age > 16 Correlation Summary
| Measurement | Immigrants from North Macedonia | Immigrants from Hungary |
| Minimum | 60.2% | 36.0% |
| Maximum | 78.4% | 76.0% |
| Range | 18.2% | 40.0% |
| Mean | 66.1% | 55.8% |
| Median | 65.4% | 60.0% |
| Interquartile 25% (IQ1) | 63.5% | 44.0% |
| Interquartile 75% (IQ3) | 67.8% | 63.1% |
| Interquartile Range (IQR) | 4.3% | 19.1% |
| Standard Deviation (Sample) | 4.0% | 11.1% |
| Standard Deviation (Population) | 4.0% | 10.9% |
Similar Demographics by In Labor Force | Age > 16
Demographics Similar to Immigrants from North Macedonia by In Labor Force | Age > 16
In terms of in labor force | age > 16, the demographic groups most similar to Immigrants from North Macedonia are Immigrants from Guatemala (65.6%, a difference of 0.010%), Icelander (65.6%, a difference of 0.010%), Immigrants from Philippines (65.6%, a difference of 0.020%), Ecuadorian (65.6%, a difference of 0.030%), and Immigrants from Lithuania (65.6%, a difference of 0.030%).
| Demographics | Rating | Rank | In Labor Force | Age > 16 |
| Norwegians | 95.3 /100 | #125 | Exceptional 65.7% |
| Koreans | 95.3 /100 | #126 | Exceptional 65.7% |
| Immigrants | Eastern Asia | 94.9 /100 | #127 | Exceptional 65.7% |
| Ecuadorians | 94.7 /100 | #128 | Exceptional 65.6% |
| Immigrants | Philippines | 94.5 /100 | #129 | Exceptional 65.6% |
| Immigrants | Guatemala | 94.4 /100 | #130 | Exceptional 65.6% |
| Icelanders | 94.3 /100 | #131 | Exceptional 65.6% |
| Immigrants | North Macedonia | 94.1 /100 | #132 | Exceptional 65.6% |
| Immigrants | Lithuania | 93.5 /100 | #133 | Exceptional 65.6% |
| Costa Ricans | 93.2 /100 | #134 | Exceptional 65.6% |
| Guatemalans | 92.5 /100 | #135 | Exceptional 65.6% |
| Immigrants | Argentina | 92.4 /100 | #136 | Exceptional 65.6% |
| Guamanians/Chamorros | 92.4 /100 | #137 | Exceptional 65.6% |
| Immigrants | West Indies | 92.0 /100 | #138 | Exceptional 65.6% |
| Immigrants | Taiwan | 90.8 /100 | #139 | Exceptional 65.5% |
Demographics Similar to Immigrants from Hungary by In Labor Force | Age > 16
In terms of in labor force | age > 16, the demographic groups most similar to Immigrants from Hungary are Lebanese (64.5%, a difference of 0.010%), Immigrants from Bangladesh (64.5%, a difference of 0.020%), Immigrants from Dominica (64.5%, a difference of 0.020%), Immigrants from Netherlands (64.5%, a difference of 0.030%), and Immigrants from Lebanon (64.5%, a difference of 0.050%).
| Demographics | Rating | Rank | In Labor Force | Age > 16 |
| Africans | 5.8 /100 | #232 | Tragic 64.6% |
| Slavs | 4.9 /100 | #233 | Tragic 64.6% |
| Vietnamese | 4.7 /100 | #234 | Tragic 64.6% |
| Austrians | 4.6 /100 | #235 | Tragic 64.6% |
| Immigrants | Norway | 4.6 /100 | #236 | Tragic 64.6% |
| Italians | 4.6 /100 | #237 | Tragic 64.6% |
| Lebanese | 3.9 /100 | #238 | Tragic 64.5% |
| Immigrants | Hungary | 3.8 /100 | #239 | Tragic 64.5% |
| Immigrants | Bangladesh | 3.6 /100 | #240 | Tragic 64.5% |
| Immigrants | Dominica | 3.5 /100 | #241 | Tragic 64.5% |
| Immigrants | Netherlands | 3.4 /100 | #242 | Tragic 64.5% |
| Immigrants | Lebanon | 3.2 /100 | #243 | Tragic 64.5% |
| Tsimshian | 3.1 /100 | #244 | Tragic 64.5% |
| West Indians | 3.0 /100 | #245 | Tragic 64.5% |
| Immigrants | Caribbean | 2.3 /100 | #246 | Tragic 64.4% |