Immigrants from North Macedonia vs English In Labor Force | Age > 16
COMPARE
Immigrants from North Macedonia
English
In Labor Force | Age > 16
In Labor Force | Age > 16 Comparison
Immigrants from North Macedonia
English
65.6%
IN LABOR FORCE | AGE > 16
94.1/ 100
METRIC RATING
132nd/ 347
METRIC RANK
63.7%
IN LABOR FORCE | AGE > 16
0.1/ 100
METRIC RATING
293rd/ 347
METRIC RANK
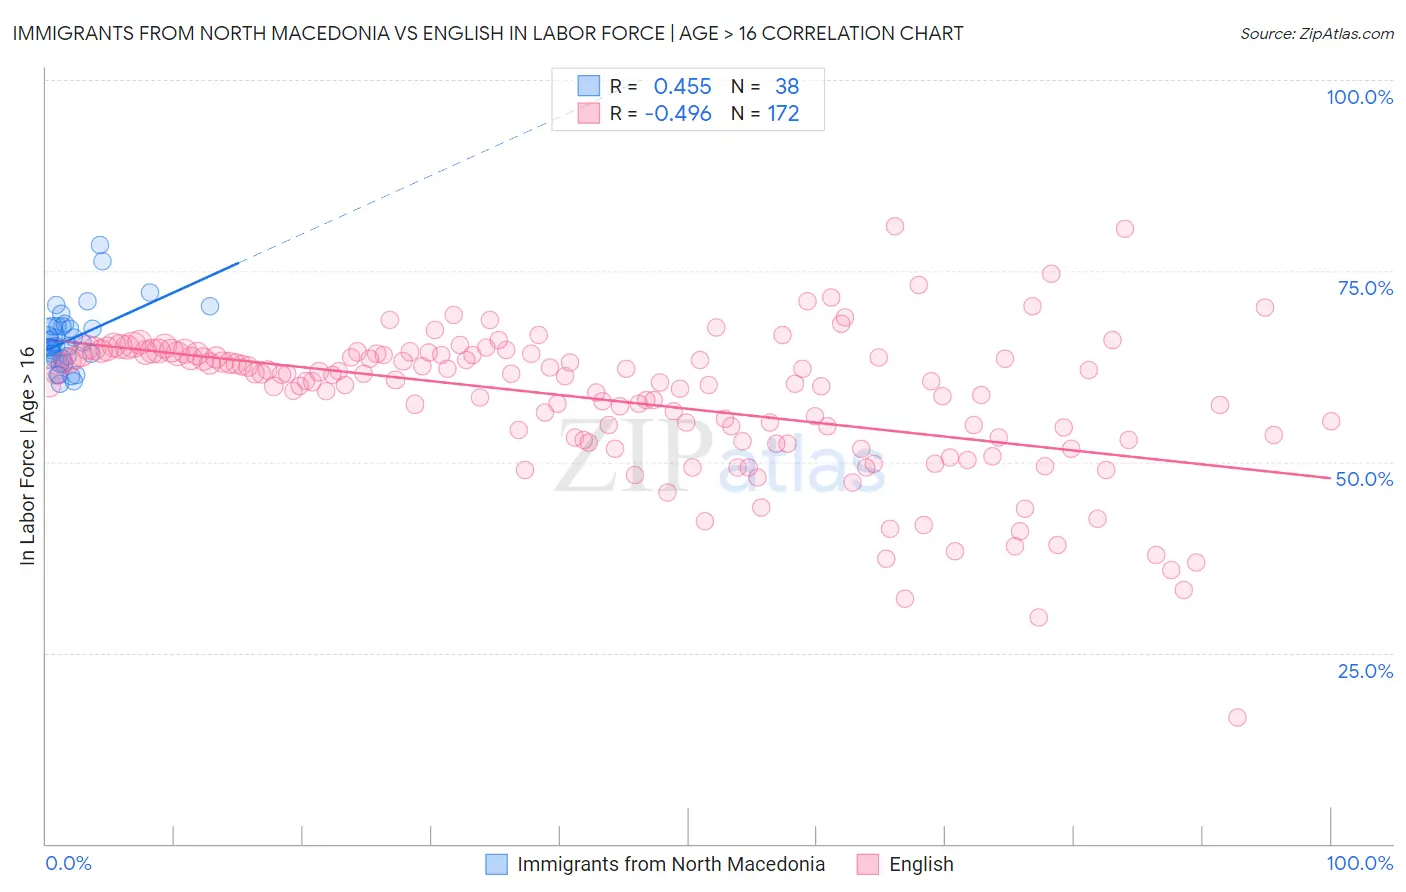
Immigrants from North Macedonia vs English In Labor Force | Age > 16 Correlation Chart
The statistical analysis conducted on geographies consisting of 74,317,186 people shows a moderate positive correlation between the proportion of Immigrants from North Macedonia and labor force participation rate among population ages 16 and over in the United States with a correlation coefficient (R) of 0.455 and weighted average of 65.6%. Similarly, the statistical analysis conducted on geographies consisting of 579,971,917 people shows a moderate negative correlation between the proportion of English and labor force participation rate among population ages 16 and over in the United States with a correlation coefficient (R) of -0.496 and weighted average of 63.7%, a difference of 2.9%.
In Labor Force | Age > 16 Correlation Summary
| Measurement | Immigrants from North Macedonia | English |
| Minimum | 60.2% | 16.6% |
| Maximum | 78.4% | 80.8% |
| Range | 18.2% | 64.2% |
| Mean | 66.1% | 58.1% |
| Median | 65.4% | 61.0% |
| Interquartile 25% (IQ1) | 63.5% | 53.1% |
| Interquartile 75% (IQ3) | 67.8% | 64.1% |
| Interquartile Range (IQR) | 4.3% | 11.1% |
| Standard Deviation (Sample) | 4.0% | 9.5% |
| Standard Deviation (Population) | 4.0% | 9.5% |
Similar Demographics by In Labor Force | Age > 16
Demographics Similar to Immigrants from North Macedonia by In Labor Force | Age > 16
In terms of in labor force | age > 16, the demographic groups most similar to Immigrants from North Macedonia are Immigrants from Guatemala (65.6%, a difference of 0.010%), Icelander (65.6%, a difference of 0.010%), Immigrants from Philippines (65.6%, a difference of 0.020%), Ecuadorian (65.6%, a difference of 0.030%), and Immigrants from Lithuania (65.6%, a difference of 0.030%).
| Demographics | Rating | Rank | In Labor Force | Age > 16 |
| Norwegians | 95.3 /100 | #125 | Exceptional 65.7% |
| Koreans | 95.3 /100 | #126 | Exceptional 65.7% |
| Immigrants | Eastern Asia | 94.9 /100 | #127 | Exceptional 65.7% |
| Ecuadorians | 94.7 /100 | #128 | Exceptional 65.6% |
| Immigrants | Philippines | 94.5 /100 | #129 | Exceptional 65.6% |
| Immigrants | Guatemala | 94.4 /100 | #130 | Exceptional 65.6% |
| Icelanders | 94.3 /100 | #131 | Exceptional 65.6% |
| Immigrants | North Macedonia | 94.1 /100 | #132 | Exceptional 65.6% |
| Immigrants | Lithuania | 93.5 /100 | #133 | Exceptional 65.6% |
| Costa Ricans | 93.2 /100 | #134 | Exceptional 65.6% |
| Guatemalans | 92.5 /100 | #135 | Exceptional 65.6% |
| Immigrants | Argentina | 92.4 /100 | #136 | Exceptional 65.6% |
| Guamanians/Chamorros | 92.4 /100 | #137 | Exceptional 65.6% |
| Immigrants | West Indies | 92.0 /100 | #138 | Exceptional 65.6% |
| Immigrants | Taiwan | 90.8 /100 | #139 | Exceptional 65.5% |
Demographics Similar to English by In Labor Force | Age > 16
In terms of in labor force | age > 16, the demographic groups most similar to English are Puget Sound Salish (63.7%, a difference of 0.030%), Spanish American Indian (63.8%, a difference of 0.040%), Immigrants from Canada (63.7%, a difference of 0.080%), Nepalese (63.8%, a difference of 0.10%), and Immigrants from North America (63.7%, a difference of 0.10%).
| Demographics | Rating | Rank | In Labor Force | Age > 16 |
| Immigrants | Austria | 0.1 /100 | #286 | Tragic 63.9% |
| Scottish | 0.1 /100 | #287 | Tragic 63.9% |
| Spanish | 0.1 /100 | #288 | Tragic 63.9% |
| Celtics | 0.1 /100 | #289 | Tragic 63.8% |
| Hungarians | 0.1 /100 | #290 | Tragic 63.8% |
| Nepalese | 0.1 /100 | #291 | Tragic 63.8% |
| Spanish American Indians | 0.1 /100 | #292 | Tragic 63.8% |
| English | 0.1 /100 | #293 | Tragic 63.7% |
| Puget Sound Salish | 0.0 /100 | #294 | Tragic 63.7% |
| Immigrants | Canada | 0.0 /100 | #295 | Tragic 63.7% |
| Immigrants | North America | 0.0 /100 | #296 | Tragic 63.7% |
| Immigrants | Grenada | 0.0 /100 | #297 | Tragic 63.6% |
| Comanche | 0.0 /100 | #298 | Tragic 63.6% |
| Whites/Caucasians | 0.0 /100 | #299 | Tragic 63.6% |
| Immigrants | Azores | 0.0 /100 | #300 | Tragic 63.6% |