Immigrants from Jordan vs Immigrants from Hungary In Labor Force | Age > 16
COMPARE
Immigrants from Jordan
Immigrants from Hungary
In Labor Force | Age > 16
In Labor Force | Age > 16 Comparison
Immigrants from Jordan
Immigrants from Hungary
66.1%
IN LABOR FORCE | AGE > 16
99.4/ 100
METRIC RATING
83rd/ 347
METRIC RANK
64.5%
IN LABOR FORCE | AGE > 16
3.8/ 100
METRIC RATING
239th/ 347
METRIC RANK
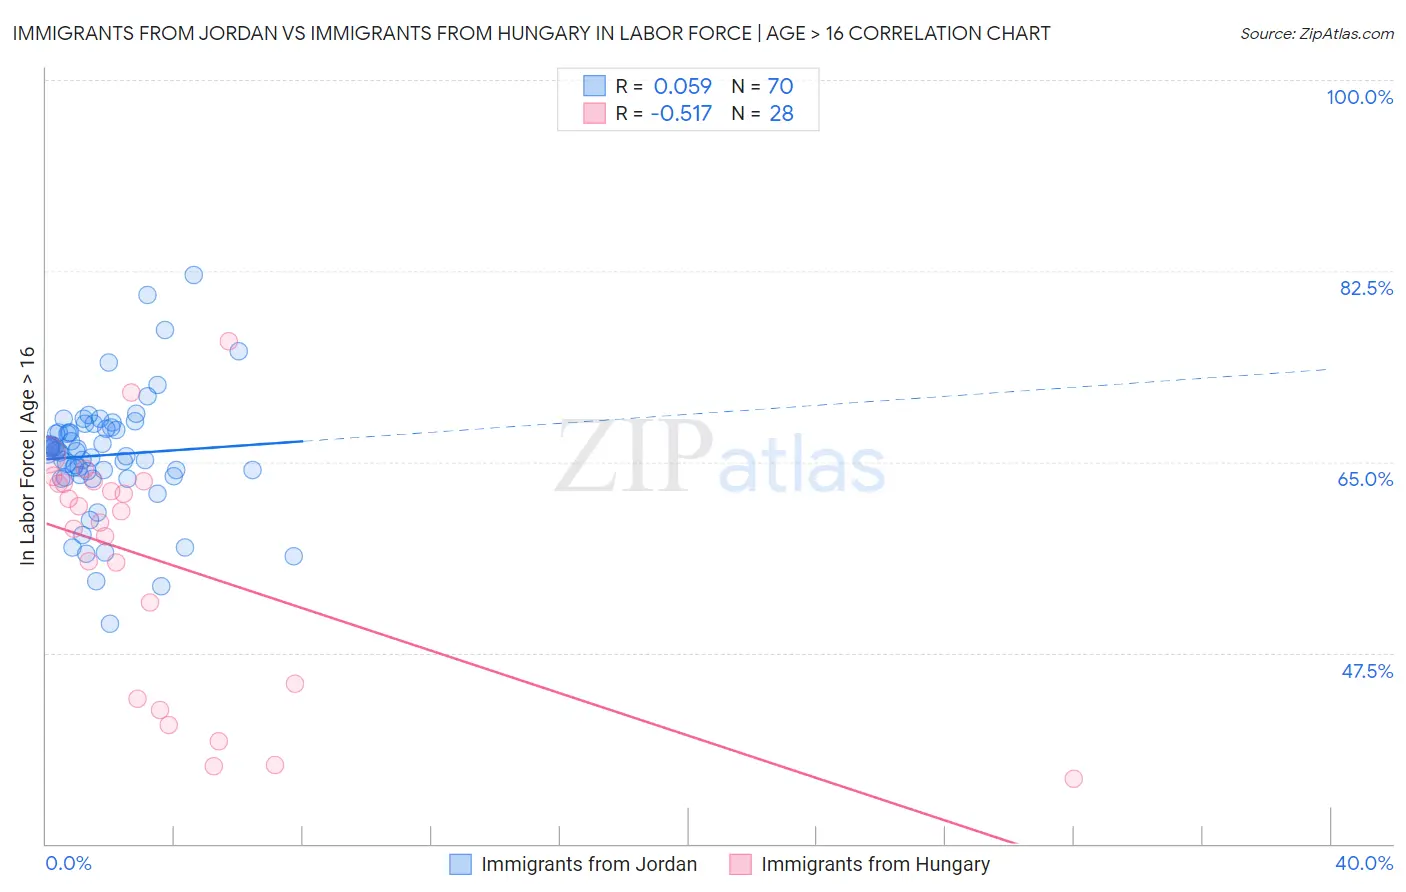
Immigrants from Jordan vs Immigrants from Hungary In Labor Force | Age > 16 Correlation Chart
The statistical analysis conducted on geographies consisting of 181,280,783 people shows a slight positive correlation between the proportion of Immigrants from Jordan and labor force participation rate among population ages 16 and over in the United States with a correlation coefficient (R) of 0.059 and weighted average of 66.1%. Similarly, the statistical analysis conducted on geographies consisting of 195,708,395 people shows a substantial negative correlation between the proportion of Immigrants from Hungary and labor force participation rate among population ages 16 and over in the United States with a correlation coefficient (R) of -0.517 and weighted average of 64.5%, a difference of 2.4%.
In Labor Force | Age > 16 Correlation Summary
| Measurement | Immigrants from Jordan | Immigrants from Hungary |
| Minimum | 50.2% | 36.0% |
| Maximum | 82.1% | 76.0% |
| Range | 31.9% | 40.0% |
| Mean | 65.6% | 55.8% |
| Median | 66.0% | 60.0% |
| Interquartile 25% (IQ1) | 63.8% | 44.0% |
| Interquartile 75% (IQ3) | 68.0% | 63.1% |
| Interquartile Range (IQR) | 4.2% | 19.1% |
| Standard Deviation (Sample) | 5.5% | 11.1% |
| Standard Deviation (Population) | 5.4% | 10.9% |
Similar Demographics by In Labor Force | Age > 16
Demographics Similar to Immigrants from Jordan by In Labor Force | Age > 16
In terms of in labor force | age > 16, the demographic groups most similar to Immigrants from Jordan are German Russian (66.1%, a difference of 0.0%), Central American (66.1%, a difference of 0.0%), Moroccan (66.1%, a difference of 0.010%), Mongolian (66.1%, a difference of 0.020%), and South American (66.0%, a difference of 0.040%).
| Demographics | Rating | Rank | In Labor Force | Age > 16 |
| Immigrants | Malaysia | 99.6 /100 | #76 | Exceptional 66.1% |
| Immigrants | Moldova | 99.6 /100 | #77 | Exceptional 66.1% |
| Immigrants | Asia | 99.6 /100 | #78 | Exceptional 66.1% |
| Turks | 99.6 /100 | #79 | Exceptional 66.1% |
| Malaysians | 99.6 /100 | #80 | Exceptional 66.1% |
| Moroccans | 99.5 /100 | #81 | Exceptional 66.1% |
| German Russians | 99.4 /100 | #82 | Exceptional 66.1% |
| Immigrants | Jordan | 99.4 /100 | #83 | Exceptional 66.1% |
| Central Americans | 99.4 /100 | #84 | Exceptional 66.1% |
| Mongolians | 99.4 /100 | #85 | Exceptional 66.1% |
| South Americans | 99.4 /100 | #86 | Exceptional 66.0% |
| South American Indians | 99.4 /100 | #87 | Exceptional 66.0% |
| Bermudans | 99.3 /100 | #88 | Exceptional 66.0% |
| Immigrants | Laos | 99.2 /100 | #89 | Exceptional 66.0% |
| Chileans | 99.2 /100 | #90 | Exceptional 66.0% |
Demographics Similar to Immigrants from Hungary by In Labor Force | Age > 16
In terms of in labor force | age > 16, the demographic groups most similar to Immigrants from Hungary are Lebanese (64.5%, a difference of 0.010%), Immigrants from Bangladesh (64.5%, a difference of 0.020%), Immigrants from Dominica (64.5%, a difference of 0.020%), Immigrants from Netherlands (64.5%, a difference of 0.030%), and Immigrants from Lebanon (64.5%, a difference of 0.050%).
| Demographics | Rating | Rank | In Labor Force | Age > 16 |
| Africans | 5.8 /100 | #232 | Tragic 64.6% |
| Slavs | 4.9 /100 | #233 | Tragic 64.6% |
| Vietnamese | 4.7 /100 | #234 | Tragic 64.6% |
| Austrians | 4.6 /100 | #235 | Tragic 64.6% |
| Immigrants | Norway | 4.6 /100 | #236 | Tragic 64.6% |
| Italians | 4.6 /100 | #237 | Tragic 64.6% |
| Lebanese | 3.9 /100 | #238 | Tragic 64.5% |
| Immigrants | Hungary | 3.8 /100 | #239 | Tragic 64.5% |
| Immigrants | Bangladesh | 3.6 /100 | #240 | Tragic 64.5% |
| Immigrants | Dominica | 3.5 /100 | #241 | Tragic 64.5% |
| Immigrants | Netherlands | 3.4 /100 | #242 | Tragic 64.5% |
| Immigrants | Lebanon | 3.2 /100 | #243 | Tragic 64.5% |
| Tsimshian | 3.1 /100 | #244 | Tragic 64.5% |
| West Indians | 3.0 /100 | #245 | Tragic 64.5% |
| Immigrants | Caribbean | 2.3 /100 | #246 | Tragic 64.4% |