Immigrants from North Macedonia vs Chilean In Labor Force | Age > 16
COMPARE
Immigrants from North Macedonia
Chilean
In Labor Force | Age > 16
In Labor Force | Age > 16 Comparison
Immigrants from North Macedonia
Chileans
65.6%
IN LABOR FORCE | AGE > 16
94.1/ 100
METRIC RATING
132nd/ 347
METRIC RANK
66.0%
IN LABOR FORCE | AGE > 16
99.2/ 100
METRIC RATING
90th/ 347
METRIC RANK
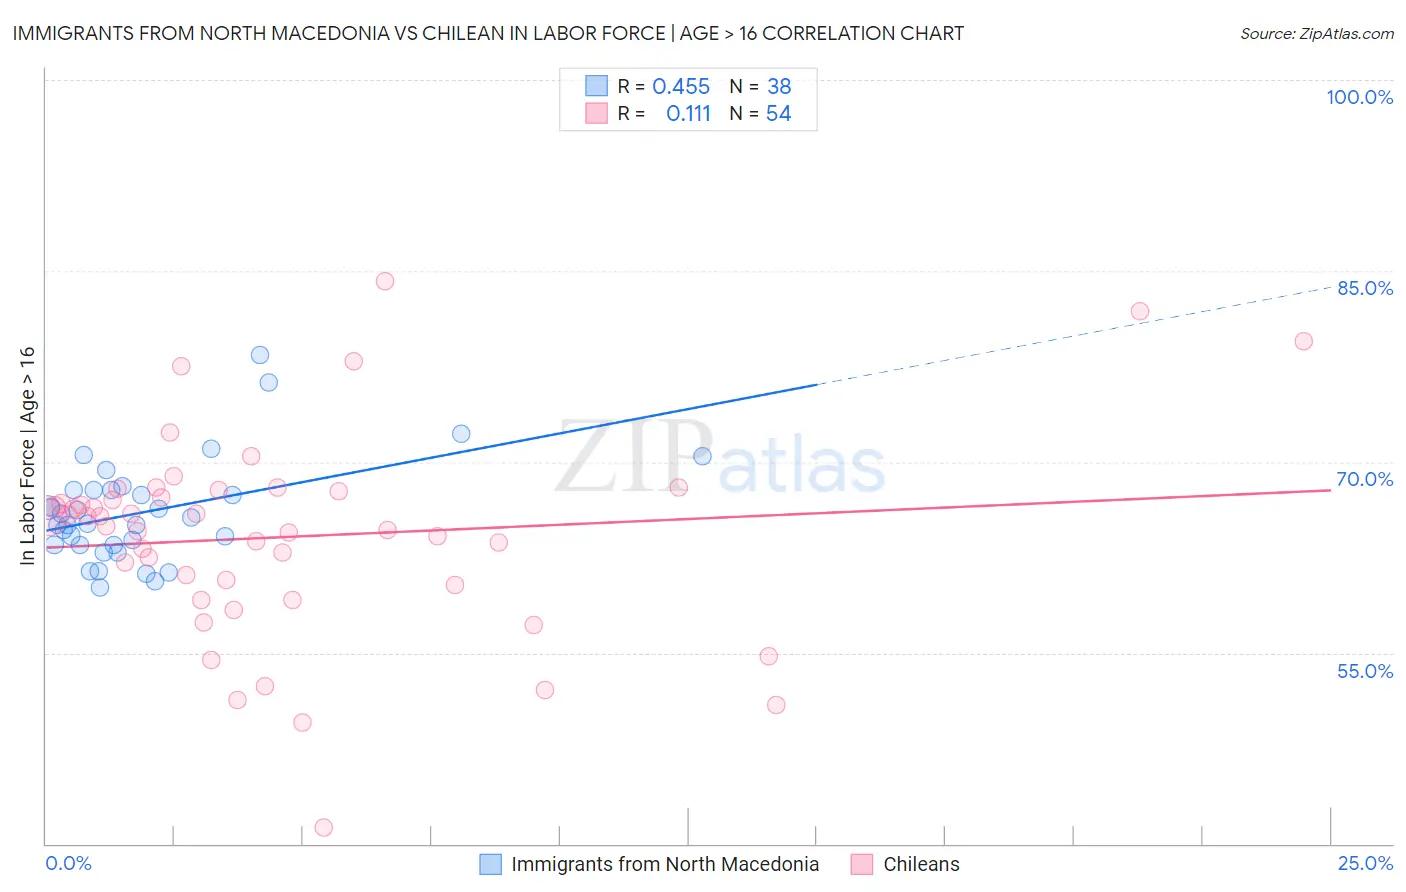
Immigrants from North Macedonia vs Chilean In Labor Force | Age > 16 Correlation Chart
The statistical analysis conducted on geographies consisting of 74,317,186 people shows a moderate positive correlation between the proportion of Immigrants from North Macedonia and labor force participation rate among population ages 16 and over in the United States with a correlation coefficient (R) of 0.455 and weighted average of 65.6%. Similarly, the statistical analysis conducted on geographies consisting of 256,687,102 people shows a poor positive correlation between the proportion of Chileans and labor force participation rate among population ages 16 and over in the United States with a correlation coefficient (R) of 0.111 and weighted average of 66.0%, a difference of 0.58%.
In Labor Force | Age > 16 Correlation Summary
| Measurement | Immigrants from North Macedonia | Chilean |
| Minimum | 60.2% | 41.3% |
| Maximum | 78.4% | 84.2% |
| Range | 18.2% | 42.9% |
| Mean | 66.1% | 64.1% |
| Median | 65.4% | 65.3% |
| Interquartile 25% (IQ1) | 63.5% | 60.3% |
| Interquartile 75% (IQ3) | 67.8% | 67.7% |
| Interquartile Range (IQR) | 4.3% | 7.4% |
| Standard Deviation (Sample) | 4.0% | 8.0% |
| Standard Deviation (Population) | 4.0% | 7.9% |
Similar Demographics by In Labor Force | Age > 16
Demographics Similar to Immigrants from North Macedonia by In Labor Force | Age > 16
In terms of in labor force | age > 16, the demographic groups most similar to Immigrants from North Macedonia are Immigrants from Guatemala (65.6%, a difference of 0.010%), Icelander (65.6%, a difference of 0.010%), Immigrants from Philippines (65.6%, a difference of 0.020%), Ecuadorian (65.6%, a difference of 0.030%), and Immigrants from Lithuania (65.6%, a difference of 0.030%).
| Demographics | Rating | Rank | In Labor Force | Age > 16 |
| Norwegians | 95.3 /100 | #125 | Exceptional 65.7% |
| Koreans | 95.3 /100 | #126 | Exceptional 65.7% |
| Immigrants | Eastern Asia | 94.9 /100 | #127 | Exceptional 65.7% |
| Ecuadorians | 94.7 /100 | #128 | Exceptional 65.6% |
| Immigrants | Philippines | 94.5 /100 | #129 | Exceptional 65.6% |
| Immigrants | Guatemala | 94.4 /100 | #130 | Exceptional 65.6% |
| Icelanders | 94.3 /100 | #131 | Exceptional 65.6% |
| Immigrants | North Macedonia | 94.1 /100 | #132 | Exceptional 65.6% |
| Immigrants | Lithuania | 93.5 /100 | #133 | Exceptional 65.6% |
| Costa Ricans | 93.2 /100 | #134 | Exceptional 65.6% |
| Guatemalans | 92.5 /100 | #135 | Exceptional 65.6% |
| Immigrants | Argentina | 92.4 /100 | #136 | Exceptional 65.6% |
| Guamanians/Chamorros | 92.4 /100 | #137 | Exceptional 65.6% |
| Immigrants | West Indies | 92.0 /100 | #138 | Exceptional 65.6% |
| Immigrants | Taiwan | 90.8 /100 | #139 | Exceptional 65.5% |
Demographics Similar to Chileans by In Labor Force | Age > 16
In terms of in labor force | age > 16, the demographic groups most similar to Chileans are Immigrants from Laos (66.0%, a difference of 0.0%), Iranian (66.0%, a difference of 0.010%), Aleut (66.0%, a difference of 0.030%), Immigrants from South America (66.0%, a difference of 0.030%), and South American Indian (66.0%, a difference of 0.050%).
| Demographics | Rating | Rank | In Labor Force | Age > 16 |
| Immigrants | Jordan | 99.4 /100 | #83 | Exceptional 66.1% |
| Central Americans | 99.4 /100 | #84 | Exceptional 66.1% |
| Mongolians | 99.4 /100 | #85 | Exceptional 66.1% |
| South Americans | 99.4 /100 | #86 | Exceptional 66.0% |
| South American Indians | 99.4 /100 | #87 | Exceptional 66.0% |
| Bermudans | 99.3 /100 | #88 | Exceptional 66.0% |
| Immigrants | Laos | 99.2 /100 | #89 | Exceptional 66.0% |
| Chileans | 99.2 /100 | #90 | Exceptional 66.0% |
| Iranians | 99.2 /100 | #91 | Exceptional 66.0% |
| Aleuts | 99.1 /100 | #92 | Exceptional 66.0% |
| Immigrants | South America | 99.1 /100 | #93 | Exceptional 66.0% |
| Immigrants | Cambodia | 99.1 /100 | #94 | Exceptional 66.0% |
| Immigrants | Uruguay | 99.1 /100 | #95 | Exceptional 66.0% |
| Bangladeshis | 98.9 /100 | #96 | Exceptional 65.9% |
| Filipinos | 98.9 /100 | #97 | Exceptional 65.9% |