Slovak vs Immigrants from Hungary In Labor Force | Age > 16
COMPARE
Slovak
Immigrants from Hungary
In Labor Force | Age > 16
In Labor Force | Age > 16 Comparison
Slovaks
Immigrants from Hungary
63.9%
IN LABOR FORCE | AGE > 16
0.1/ 100
METRIC RATING
285th/ 347
METRIC RANK
64.5%
IN LABOR FORCE | AGE > 16
3.8/ 100
METRIC RATING
239th/ 347
METRIC RANK
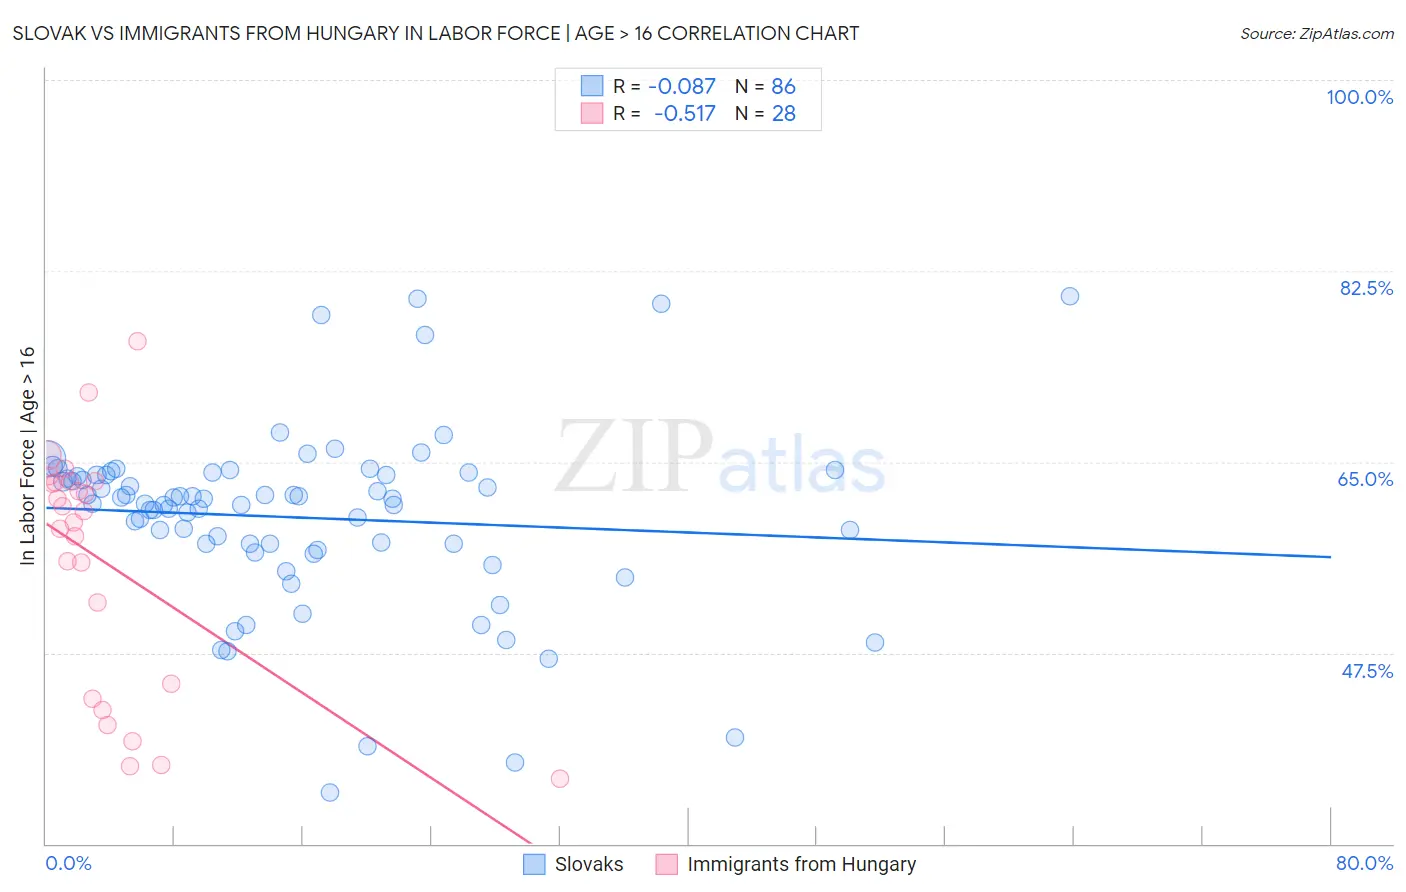
Slovak vs Immigrants from Hungary In Labor Force | Age > 16 Correlation Chart
The statistical analysis conducted on geographies consisting of 397,893,626 people shows a slight negative correlation between the proportion of Slovaks and labor force participation rate among population ages 16 and over in the United States with a correlation coefficient (R) of -0.087 and weighted average of 63.9%. Similarly, the statistical analysis conducted on geographies consisting of 195,708,395 people shows a substantial negative correlation between the proportion of Immigrants from Hungary and labor force participation rate among population ages 16 and over in the United States with a correlation coefficient (R) of -0.517 and weighted average of 64.5%, a difference of 0.99%.
In Labor Force | Age > 16 Correlation Summary
| Measurement | Slovak | Immigrants from Hungary |
| Minimum | 34.7% | 36.0% |
| Maximum | 80.2% | 76.0% |
| Range | 45.5% | 40.0% |
| Mean | 59.9% | 55.8% |
| Median | 61.4% | 60.0% |
| Interquartile 25% (IQ1) | 57.4% | 44.0% |
| Interquartile 75% (IQ3) | 63.8% | 63.1% |
| Interquartile Range (IQR) | 6.4% | 19.1% |
| Standard Deviation (Sample) | 8.2% | 11.1% |
| Standard Deviation (Population) | 8.2% | 10.9% |
Similar Demographics by In Labor Force | Age > 16
Demographics Similar to Slovaks by In Labor Force | Age > 16
In terms of in labor force | age > 16, the demographic groups most similar to Slovaks are French (63.9%, a difference of 0.030%), Immigrants from Austria (63.9%, a difference of 0.030%), Scottish (63.9%, a difference of 0.030%), Immigrants from Germany (63.9%, a difference of 0.040%), and Spanish (63.9%, a difference of 0.070%).
| Demographics | Rating | Rank | In Labor Force | Age > 16 |
| Assyrians/Chaldeans/Syriacs | 0.3 /100 | #278 | Tragic 64.0% |
| Welsh | 0.2 /100 | #279 | Tragic 64.0% |
| Immigrants | St. Vincent and the Grenadines | 0.2 /100 | #280 | Tragic 64.0% |
| French Canadians | 0.2 /100 | #281 | Tragic 64.0% |
| Immigrants | Guyana | 0.2 /100 | #282 | Tragic 64.0% |
| Immigrants | Germany | 0.1 /100 | #283 | Tragic 63.9% |
| French | 0.1 /100 | #284 | Tragic 63.9% |
| Slovaks | 0.1 /100 | #285 | Tragic 63.9% |
| Immigrants | Austria | 0.1 /100 | #286 | Tragic 63.9% |
| Scottish | 0.1 /100 | #287 | Tragic 63.9% |
| Spanish | 0.1 /100 | #288 | Tragic 63.9% |
| Celtics | 0.1 /100 | #289 | Tragic 63.8% |
| Hungarians | 0.1 /100 | #290 | Tragic 63.8% |
| Nepalese | 0.1 /100 | #291 | Tragic 63.8% |
| Spanish American Indians | 0.1 /100 | #292 | Tragic 63.8% |
Demographics Similar to Immigrants from Hungary by In Labor Force | Age > 16
In terms of in labor force | age > 16, the demographic groups most similar to Immigrants from Hungary are Lebanese (64.5%, a difference of 0.010%), Immigrants from Bangladesh (64.5%, a difference of 0.020%), Immigrants from Dominica (64.5%, a difference of 0.020%), Immigrants from Netherlands (64.5%, a difference of 0.030%), and Immigrants from Lebanon (64.5%, a difference of 0.050%).
| Demographics | Rating | Rank | In Labor Force | Age > 16 |
| Africans | 5.8 /100 | #232 | Tragic 64.6% |
| Slavs | 4.9 /100 | #233 | Tragic 64.6% |
| Vietnamese | 4.7 /100 | #234 | Tragic 64.6% |
| Austrians | 4.6 /100 | #235 | Tragic 64.6% |
| Immigrants | Norway | 4.6 /100 | #236 | Tragic 64.6% |
| Italians | 4.6 /100 | #237 | Tragic 64.6% |
| Lebanese | 3.9 /100 | #238 | Tragic 64.5% |
| Immigrants | Hungary | 3.8 /100 | #239 | Tragic 64.5% |
| Immigrants | Bangladesh | 3.6 /100 | #240 | Tragic 64.5% |
| Immigrants | Dominica | 3.5 /100 | #241 | Tragic 64.5% |
| Immigrants | Netherlands | 3.4 /100 | #242 | Tragic 64.5% |
| Immigrants | Lebanon | 3.2 /100 | #243 | Tragic 64.5% |
| Tsimshian | 3.1 /100 | #244 | Tragic 64.5% |
| West Indians | 3.0 /100 | #245 | Tragic 64.5% |
| Immigrants | Caribbean | 2.3 /100 | #246 | Tragic 64.4% |