Immigrants from North Macedonia vs Cajun In Labor Force | Age > 16
COMPARE
Immigrants from North Macedonia
Cajun
In Labor Force | Age > 16
In Labor Force | Age > 16 Comparison
Immigrants from North Macedonia
Cajuns
65.6%
IN LABOR FORCE | AGE > 16
94.1/ 100
METRIC RATING
132nd/ 347
METRIC RANK
61.8%
IN LABOR FORCE | AGE > 16
0.0/ 100
METRIC RATING
327th/ 347
METRIC RANK
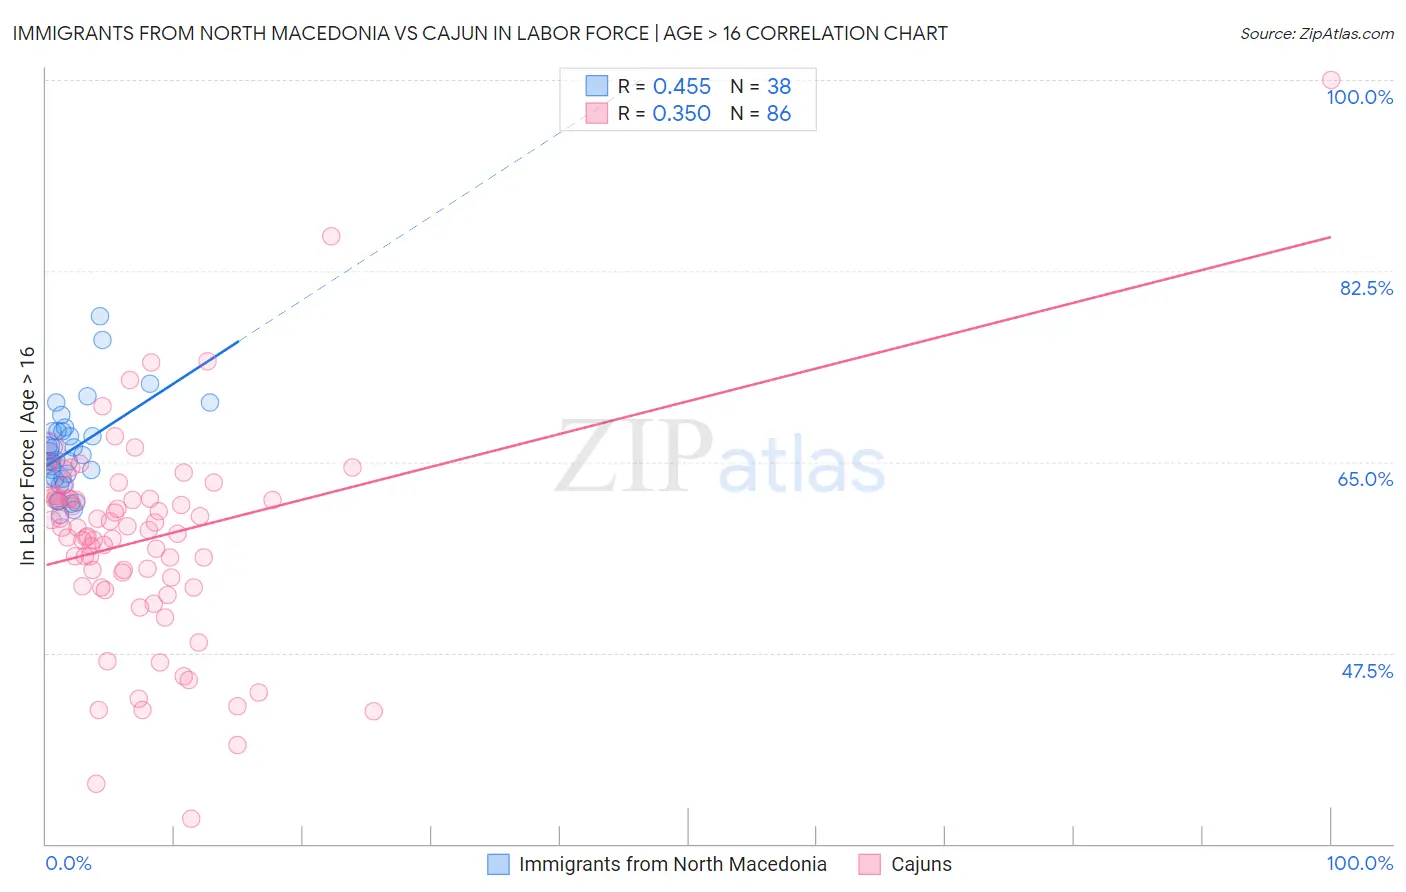
Immigrants from North Macedonia vs Cajun In Labor Force | Age > 16 Correlation Chart
The statistical analysis conducted on geographies consisting of 74,317,186 people shows a moderate positive correlation between the proportion of Immigrants from North Macedonia and labor force participation rate among population ages 16 and over in the United States with a correlation coefficient (R) of 0.455 and weighted average of 65.6%. Similarly, the statistical analysis conducted on geographies consisting of 149,712,932 people shows a mild positive correlation between the proportion of Cajuns and labor force participation rate among population ages 16 and over in the United States with a correlation coefficient (R) of 0.350 and weighted average of 61.8%, a difference of 6.2%.
In Labor Force | Age > 16 Correlation Summary
| Measurement | Immigrants from North Macedonia | Cajun |
| Minimum | 60.2% | 32.3% |
| Maximum | 78.4% | 100.0% |
| Range | 18.2% | 67.7% |
| Mean | 66.1% | 57.9% |
| Median | 65.4% | 58.9% |
| Interquartile 25% (IQ1) | 63.5% | 53.6% |
| Interquartile 75% (IQ3) | 67.8% | 61.6% |
| Interquartile Range (IQR) | 4.3% | 8.0% |
| Standard Deviation (Sample) | 4.0% | 9.7% |
| Standard Deviation (Population) | 4.0% | 9.7% |
Similar Demographics by In Labor Force | Age > 16
Demographics Similar to Immigrants from North Macedonia by In Labor Force | Age > 16
In terms of in labor force | age > 16, the demographic groups most similar to Immigrants from North Macedonia are Immigrants from Guatemala (65.6%, a difference of 0.010%), Icelander (65.6%, a difference of 0.010%), Immigrants from Philippines (65.6%, a difference of 0.020%), Ecuadorian (65.6%, a difference of 0.030%), and Immigrants from Lithuania (65.6%, a difference of 0.030%).
| Demographics | Rating | Rank | In Labor Force | Age > 16 |
| Norwegians | 95.3 /100 | #125 | Exceptional 65.7% |
| Koreans | 95.3 /100 | #126 | Exceptional 65.7% |
| Immigrants | Eastern Asia | 94.9 /100 | #127 | Exceptional 65.7% |
| Ecuadorians | 94.7 /100 | #128 | Exceptional 65.6% |
| Immigrants | Philippines | 94.5 /100 | #129 | Exceptional 65.6% |
| Immigrants | Guatemala | 94.4 /100 | #130 | Exceptional 65.6% |
| Icelanders | 94.3 /100 | #131 | Exceptional 65.6% |
| Immigrants | North Macedonia | 94.1 /100 | #132 | Exceptional 65.6% |
| Immigrants | Lithuania | 93.5 /100 | #133 | Exceptional 65.6% |
| Costa Ricans | 93.2 /100 | #134 | Exceptional 65.6% |
| Guatemalans | 92.5 /100 | #135 | Exceptional 65.6% |
| Immigrants | Argentina | 92.4 /100 | #136 | Exceptional 65.6% |
| Guamanians/Chamorros | 92.4 /100 | #137 | Exceptional 65.6% |
| Immigrants | West Indies | 92.0 /100 | #138 | Exceptional 65.6% |
| Immigrants | Taiwan | 90.8 /100 | #139 | Exceptional 65.5% |
Demographics Similar to Cajuns by In Labor Force | Age > 16
In terms of in labor force | age > 16, the demographic groups most similar to Cajuns are Sioux (61.8%, a difference of 0.11%), Dutch West Indian (61.7%, a difference of 0.16%), Cherokee (61.9%, a difference of 0.29%), Cheyenne (62.0%, a difference of 0.34%), and Seminole (62.0%, a difference of 0.38%).
| Demographics | Rating | Rank | In Labor Force | Age > 16 |
| Yakama | 0.0 /100 | #320 | Tragic 62.1% |
| Americans | 0.0 /100 | #321 | Tragic 62.1% |
| Ottawa | 0.0 /100 | #322 | Tragic 62.0% |
| Seminole | 0.0 /100 | #323 | Tragic 62.0% |
| Cheyenne | 0.0 /100 | #324 | Tragic 62.0% |
| Cherokee | 0.0 /100 | #325 | Tragic 61.9% |
| Sioux | 0.0 /100 | #326 | Tragic 61.8% |
| Cajuns | 0.0 /100 | #327 | Tragic 61.8% |
| Dutch West Indians | 0.0 /100 | #328 | Tragic 61.7% |
| Choctaw | 0.0 /100 | #329 | Tragic 61.5% |
| Creek | 0.0 /100 | #330 | Tragic 61.3% |
| Ute | 0.0 /100 | #331 | Tragic 60.9% |
| Crow | 0.0 /100 | #332 | Tragic 60.8% |
| Paiute | 0.0 /100 | #333 | Tragic 60.7% |
| Apache | 0.0 /100 | #334 | Tragic 60.7% |