Immigrants from North Macedonia vs English Median Female Earnings
COMPARE
Immigrants from North Macedonia
English
Median Female Earnings
Median Female Earnings Comparison
Immigrants from North Macedonia
English
$40,488
MEDIAN FEMALE EARNINGS
83.8/ 100
METRIC RATING
144th/ 347
METRIC RANK
$38,196
MEDIAN FEMALE EARNINGS
4.2/ 100
METRIC RATING
239th/ 347
METRIC RANK
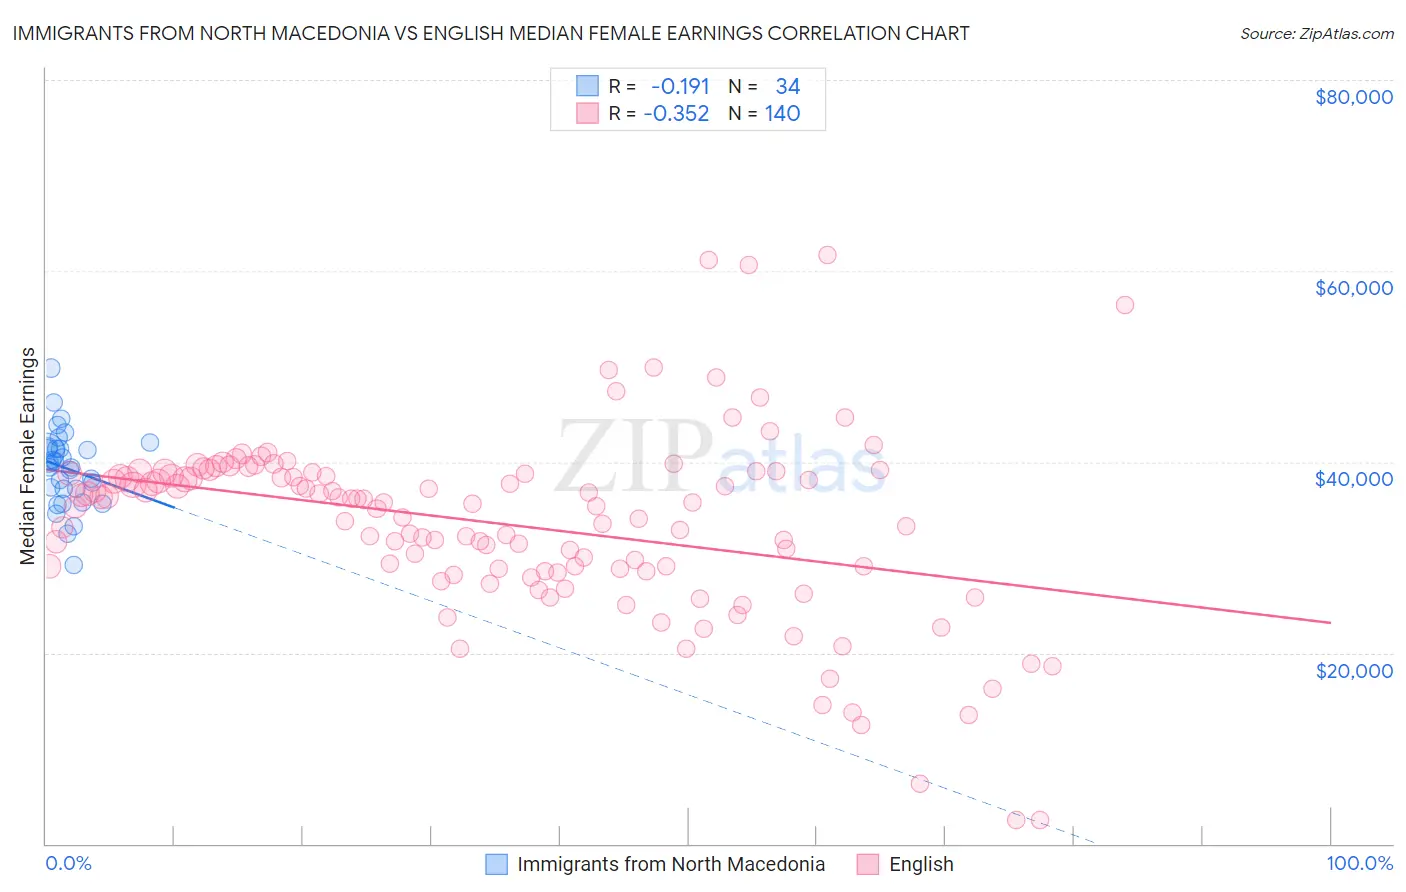
Immigrants from North Macedonia vs English Median Female Earnings Correlation Chart
The statistical analysis conducted on geographies consisting of 74,042,106 people shows a poor negative correlation between the proportion of Immigrants from North Macedonia and median female earnings in the United States with a correlation coefficient (R) of -0.191 and weighted average of $40,488. Similarly, the statistical analysis conducted on geographies consisting of 577,154,042 people shows a mild negative correlation between the proportion of English and median female earnings in the United States with a correlation coefficient (R) of -0.352 and weighted average of $38,196, a difference of 6.0%.
Median Female Earnings Correlation Summary
| Measurement | Immigrants from North Macedonia | English |
| Minimum | $29,254 | $2,499 |
| Maximum | $49,827 | $61,721 |
| Range | $20,573 | $59,222 |
| Mean | $39,315 | $33,482 |
| Median | $39,666 | $35,643 |
| Interquartile 25% (IQ1) | $37,214 | $28,708 |
| Interquartile 75% (IQ3) | $41,437 | $38,774 |
| Interquartile Range (IQR) | $4,223 | $10,066 |
| Standard Deviation (Sample) | $4,067 | $9,710 |
| Standard Deviation (Population) | $4,007 | $9,675 |
Similar Demographics by Median Female Earnings
Demographics Similar to Immigrants from North Macedonia by Median Female Earnings
In terms of median female earnings, the demographic groups most similar to Immigrants from North Macedonia are Northern European ($40,491, a difference of 0.010%), Brazilian ($40,483, a difference of 0.010%), Sri Lankan ($40,496, a difference of 0.020%), Immigrants from Syria ($40,499, a difference of 0.030%), and Serbian ($40,539, a difference of 0.12%).
| Demographics | Rating | Rank | Median Female Earnings |
| Pakistanis | 86.6 /100 | #137 | Excellent $40,596 |
| Taiwanese | 86.1 /100 | #138 | Excellent $40,576 |
| Immigrants | South Eastern Asia | 85.7 /100 | #139 | Excellent $40,558 |
| Serbians | 85.2 /100 | #140 | Excellent $40,539 |
| Immigrants | Syria | 84.1 /100 | #141 | Excellent $40,499 |
| Sri Lankans | 84.0 /100 | #142 | Excellent $40,496 |
| Northern Europeans | 83.9 /100 | #143 | Excellent $40,491 |
| Immigrants | North Macedonia | 83.8 /100 | #144 | Excellent $40,488 |
| Brazilians | 83.6 /100 | #145 | Excellent $40,483 |
| Ghanaians | 82.1 /100 | #146 | Excellent $40,429 |
| Vietnamese | 80.4 /100 | #147 | Excellent $40,377 |
| Poles | 80.2 /100 | #148 | Excellent $40,371 |
| Immigrants | Cameroon | 79.7 /100 | #149 | Good $40,354 |
| Immigrants | Chile | 79.6 /100 | #150 | Good $40,353 |
| Immigrants | Armenia | 79.2 /100 | #151 | Good $40,340 |
Demographics Similar to English by Median Female Earnings
In terms of median female earnings, the demographic groups most similar to English are Alaska Native ($38,202, a difference of 0.020%), Immigrants from Cabo Verde ($38,208, a difference of 0.030%), Sudanese ($38,215, a difference of 0.050%), Liberian ($38,215, a difference of 0.050%), and Finnish ($38,173, a difference of 0.060%).
| Demographics | Rating | Rank | Median Female Earnings |
| Scandinavians | 5.2 /100 | #232 | Tragic $38,306 |
| Tongans | 5.1 /100 | #233 | Tragic $38,288 |
| Celtics | 5.0 /100 | #234 | Tragic $38,283 |
| Sudanese | 4.4 /100 | #235 | Tragic $38,215 |
| Liberians | 4.4 /100 | #236 | Tragic $38,215 |
| Immigrants | Cabo Verde | 4.3 /100 | #237 | Tragic $38,208 |
| Alaska Natives | 4.3 /100 | #238 | Tragic $38,202 |
| English | 4.2 /100 | #239 | Tragic $38,196 |
| Finns | 4.0 /100 | #240 | Tragic $38,173 |
| Spanish | 3.5 /100 | #241 | Tragic $38,098 |
| Immigrants | Burma/Myanmar | 3.0 /100 | #242 | Tragic $38,028 |
| Germans | 2.8 /100 | #243 | Tragic $37,986 |
| Immigrants | Liberia | 2.7 /100 | #244 | Tragic $37,970 |
| Immigrants | Middle Africa | 2.7 /100 | #245 | Tragic $37,965 |
| Delaware | 2.6 /100 | #246 | Tragic $37,964 |