German Russian vs English In Labor Force | Age > 16
COMPARE
German Russian
English
In Labor Force | Age > 16
In Labor Force | Age > 16 Comparison
German Russians
English
66.1%
IN LABOR FORCE | AGE > 16
99.4/ 100
METRIC RATING
82nd/ 347
METRIC RANK
63.7%
IN LABOR FORCE | AGE > 16
0.1/ 100
METRIC RATING
293rd/ 347
METRIC RANK
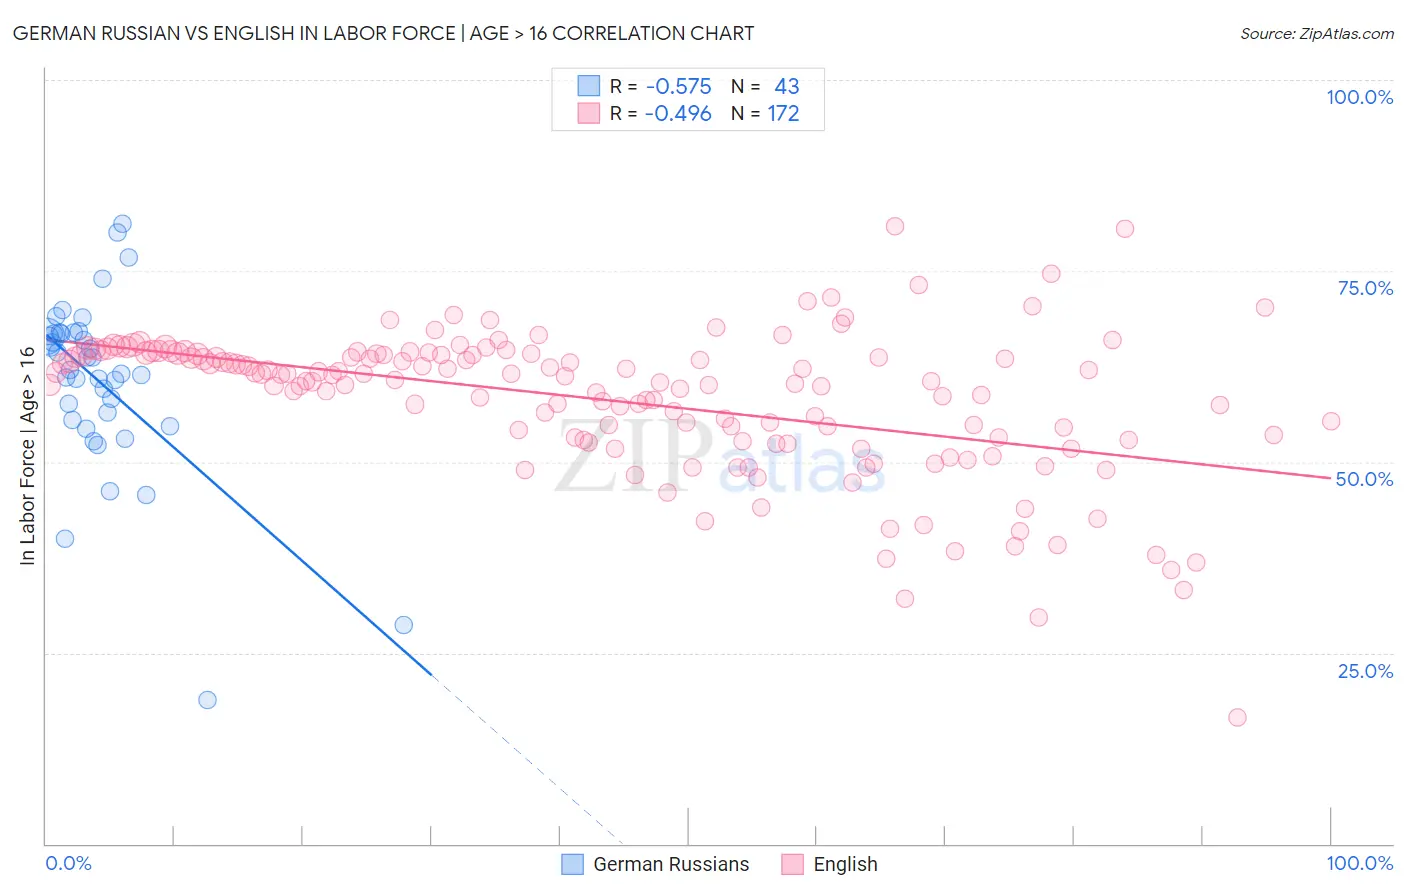
German Russian vs English In Labor Force | Age > 16 Correlation Chart
The statistical analysis conducted on geographies consisting of 96,458,979 people shows a substantial negative correlation between the proportion of German Russians and labor force participation rate among population ages 16 and over in the United States with a correlation coefficient (R) of -0.575 and weighted average of 66.1%. Similarly, the statistical analysis conducted on geographies consisting of 579,971,917 people shows a moderate negative correlation between the proportion of English and labor force participation rate among population ages 16 and over in the United States with a correlation coefficient (R) of -0.496 and weighted average of 63.7%, a difference of 3.6%.
In Labor Force | Age > 16 Correlation Summary
| Measurement | German Russian | English |
| Minimum | 18.8% | 16.6% |
| Maximum | 81.2% | 80.8% |
| Range | 62.4% | 64.2% |
| Mean | 60.5% | 58.1% |
| Median | 62.0% | 61.0% |
| Interquartile 25% (IQ1) | 55.5% | 53.1% |
| Interquartile 75% (IQ3) | 66.8% | 64.1% |
| Interquartile Range (IQR) | 11.4% | 11.1% |
| Standard Deviation (Sample) | 11.8% | 9.5% |
| Standard Deviation (Population) | 11.6% | 9.5% |
Similar Demographics by In Labor Force | Age > 16
Demographics Similar to German Russians by In Labor Force | Age > 16
In terms of in labor force | age > 16, the demographic groups most similar to German Russians are Immigrants from Jordan (66.1%, a difference of 0.0%), Moroccan (66.1%, a difference of 0.010%), Central American (66.1%, a difference of 0.010%), Mongolian (66.1%, a difference of 0.020%), and South American (66.0%, a difference of 0.040%).
| Demographics | Rating | Rank | In Labor Force | Age > 16 |
| Immigrants | Singapore | 99.7 /100 | #75 | Exceptional 66.2% |
| Immigrants | Malaysia | 99.6 /100 | #76 | Exceptional 66.1% |
| Immigrants | Moldova | 99.6 /100 | #77 | Exceptional 66.1% |
| Immigrants | Asia | 99.6 /100 | #78 | Exceptional 66.1% |
| Turks | 99.6 /100 | #79 | Exceptional 66.1% |
| Malaysians | 99.6 /100 | #80 | Exceptional 66.1% |
| Moroccans | 99.5 /100 | #81 | Exceptional 66.1% |
| German Russians | 99.4 /100 | #82 | Exceptional 66.1% |
| Immigrants | Jordan | 99.4 /100 | #83 | Exceptional 66.1% |
| Central Americans | 99.4 /100 | #84 | Exceptional 66.1% |
| Mongolians | 99.4 /100 | #85 | Exceptional 66.1% |
| South Americans | 99.4 /100 | #86 | Exceptional 66.0% |
| South American Indians | 99.4 /100 | #87 | Exceptional 66.0% |
| Bermudans | 99.3 /100 | #88 | Exceptional 66.0% |
| Immigrants | Laos | 99.2 /100 | #89 | Exceptional 66.0% |
Demographics Similar to English by In Labor Force | Age > 16
In terms of in labor force | age > 16, the demographic groups most similar to English are Puget Sound Salish (63.7%, a difference of 0.030%), Spanish American Indian (63.8%, a difference of 0.040%), Immigrants from Canada (63.7%, a difference of 0.080%), Nepalese (63.8%, a difference of 0.10%), and Immigrants from North America (63.7%, a difference of 0.10%).
| Demographics | Rating | Rank | In Labor Force | Age > 16 |
| Immigrants | Austria | 0.1 /100 | #286 | Tragic 63.9% |
| Scottish | 0.1 /100 | #287 | Tragic 63.9% |
| Spanish | 0.1 /100 | #288 | Tragic 63.9% |
| Celtics | 0.1 /100 | #289 | Tragic 63.8% |
| Hungarians | 0.1 /100 | #290 | Tragic 63.8% |
| Nepalese | 0.1 /100 | #291 | Tragic 63.8% |
| Spanish American Indians | 0.1 /100 | #292 | Tragic 63.8% |
| English | 0.1 /100 | #293 | Tragic 63.7% |
| Puget Sound Salish | 0.0 /100 | #294 | Tragic 63.7% |
| Immigrants | Canada | 0.0 /100 | #295 | Tragic 63.7% |
| Immigrants | North America | 0.0 /100 | #296 | Tragic 63.7% |
| Immigrants | Grenada | 0.0 /100 | #297 | Tragic 63.6% |
| Comanche | 0.0 /100 | #298 | Tragic 63.6% |
| Whites/Caucasians | 0.0 /100 | #299 | Tragic 63.6% |
| Immigrants | Azores | 0.0 /100 | #300 | Tragic 63.6% |