Ethiopian vs Cajun In Labor Force | Age > 16
COMPARE
Ethiopian
Cajun
In Labor Force | Age > 16
In Labor Force | Age > 16 Comparison
Ethiopians
Cajuns
69.3%
IN LABOR FORCE | AGE > 16
100.0/ 100
METRIC RATING
2nd/ 347
METRIC RANK
61.8%
IN LABOR FORCE | AGE > 16
0.0/ 100
METRIC RATING
327th/ 347
METRIC RANK
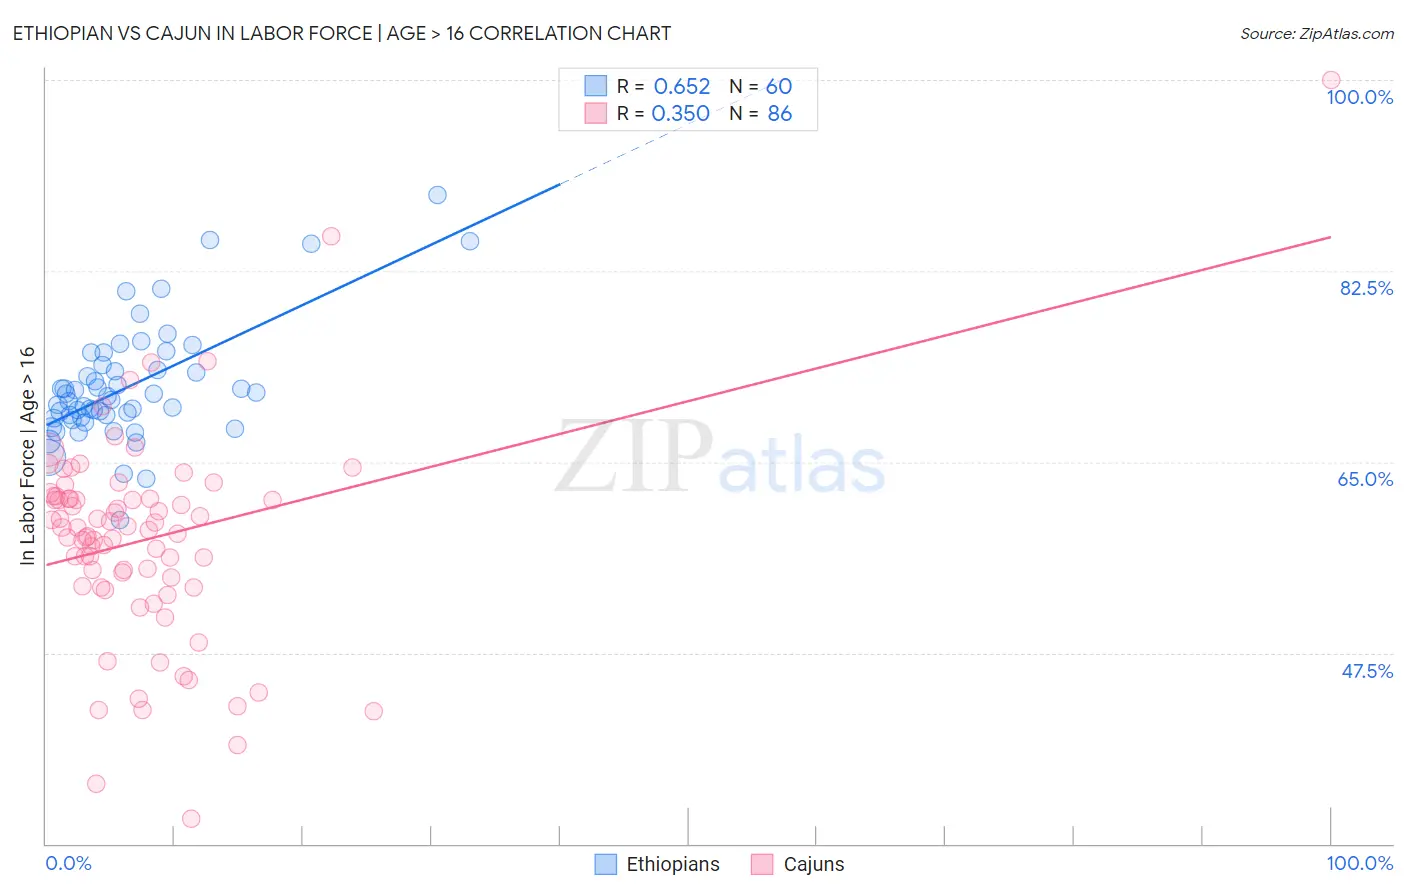
Ethiopian vs Cajun In Labor Force | Age > 16 Correlation Chart
The statistical analysis conducted on geographies consisting of 223,268,503 people shows a significant positive correlation between the proportion of Ethiopians and labor force participation rate among population ages 16 and over in the United States with a correlation coefficient (R) of 0.652 and weighted average of 69.3%. Similarly, the statistical analysis conducted on geographies consisting of 149,712,932 people shows a mild positive correlation between the proportion of Cajuns and labor force participation rate among population ages 16 and over in the United States with a correlation coefficient (R) of 0.350 and weighted average of 61.8%, a difference of 12.2%.
In Labor Force | Age > 16 Correlation Summary
| Measurement | Ethiopian | Cajun |
| Minimum | 59.7% | 32.3% |
| Maximum | 89.5% | 100.0% |
| Range | 29.8% | 67.7% |
| Mean | 71.9% | 57.9% |
| Median | 70.8% | 58.9% |
| Interquartile 25% (IQ1) | 69.0% | 53.6% |
| Interquartile 75% (IQ3) | 73.6% | 61.6% |
| Interquartile Range (IQR) | 4.6% | 8.0% |
| Standard Deviation (Sample) | 5.4% | 9.7% |
| Standard Deviation (Population) | 5.4% | 9.7% |
Similar Demographics by In Labor Force | Age > 16
Demographics Similar to Ethiopians by In Labor Force | Age > 16
In terms of in labor force | age > 16, the demographic groups most similar to Ethiopians are Immigrants from Ethiopia (69.4%, a difference of 0.16%), Somali (69.2%, a difference of 0.20%), Immigrants from Somalia (69.1%, a difference of 0.27%), Sierra Leonean (68.9%, a difference of 0.58%), and Immigrants from Eritrea (68.9%, a difference of 0.63%).
| Demographics | Rating | Rank | In Labor Force | Age > 16 |
| Immigrants | Ethiopia | 100.0 /100 | #1 | Exceptional 69.4% |
| Ethiopians | 100.0 /100 | #2 | Exceptional 69.3% |
| Somalis | 100.0 /100 | #3 | Exceptional 69.2% |
| Immigrants | Somalia | 100.0 /100 | #4 | Exceptional 69.1% |
| Sierra Leoneans | 100.0 /100 | #5 | Exceptional 68.9% |
| Immigrants | Eritrea | 100.0 /100 | #6 | Exceptional 68.9% |
| Immigrants | Cameroon | 100.0 /100 | #7 | Exceptional 68.7% |
| Immigrants | Sierra Leone | 100.0 /100 | #8 | Exceptional 68.5% |
| Immigrants | Eastern Africa | 100.0 /100 | #9 | Exceptional 68.5% |
| Immigrants | Bolivia | 100.0 /100 | #10 | Exceptional 68.4% |
| Bolivians | 100.0 /100 | #11 | Exceptional 68.2% |
| Sudanese | 100.0 /100 | #12 | Exceptional 68.0% |
| Immigrants | Nepal | 100.0 /100 | #13 | Exceptional 68.0% |
| Liberians | 100.0 /100 | #14 | Exceptional 67.8% |
| Immigrants | Middle Africa | 100.0 /100 | #15 | Exceptional 67.7% |
Demographics Similar to Cajuns by In Labor Force | Age > 16
In terms of in labor force | age > 16, the demographic groups most similar to Cajuns are Sioux (61.8%, a difference of 0.11%), Dutch West Indian (61.7%, a difference of 0.16%), Cherokee (61.9%, a difference of 0.29%), Cheyenne (62.0%, a difference of 0.34%), and Seminole (62.0%, a difference of 0.38%).
| Demographics | Rating | Rank | In Labor Force | Age > 16 |
| Yakama | 0.0 /100 | #320 | Tragic 62.1% |
| Americans | 0.0 /100 | #321 | Tragic 62.1% |
| Ottawa | 0.0 /100 | #322 | Tragic 62.0% |
| Seminole | 0.0 /100 | #323 | Tragic 62.0% |
| Cheyenne | 0.0 /100 | #324 | Tragic 62.0% |
| Cherokee | 0.0 /100 | #325 | Tragic 61.9% |
| Sioux | 0.0 /100 | #326 | Tragic 61.8% |
| Cajuns | 0.0 /100 | #327 | Tragic 61.8% |
| Dutch West Indians | 0.0 /100 | #328 | Tragic 61.7% |
| Choctaw | 0.0 /100 | #329 | Tragic 61.5% |
| Creek | 0.0 /100 | #330 | Tragic 61.3% |
| Ute | 0.0 /100 | #331 | Tragic 60.9% |
| Crow | 0.0 /100 | #332 | Tragic 60.8% |
| Paiute | 0.0 /100 | #333 | Tragic 60.7% |
| Apache | 0.0 /100 | #334 | Tragic 60.7% |