Immigrants from Netherlands vs Mexican In Labor Force | Age > 16
COMPARE
Immigrants from Netherlands
Mexican
In Labor Force | Age > 16
In Labor Force | Age > 16 Comparison
Immigrants from Netherlands
Mexicans
64.5%
IN LABOR FORCE | AGE > 16
3.4/ 100
METRIC RATING
242nd/ 347
METRIC RANK
64.1%
IN LABOR FORCE | AGE > 16
0.3/ 100
METRIC RATING
275th/ 347
METRIC RANK
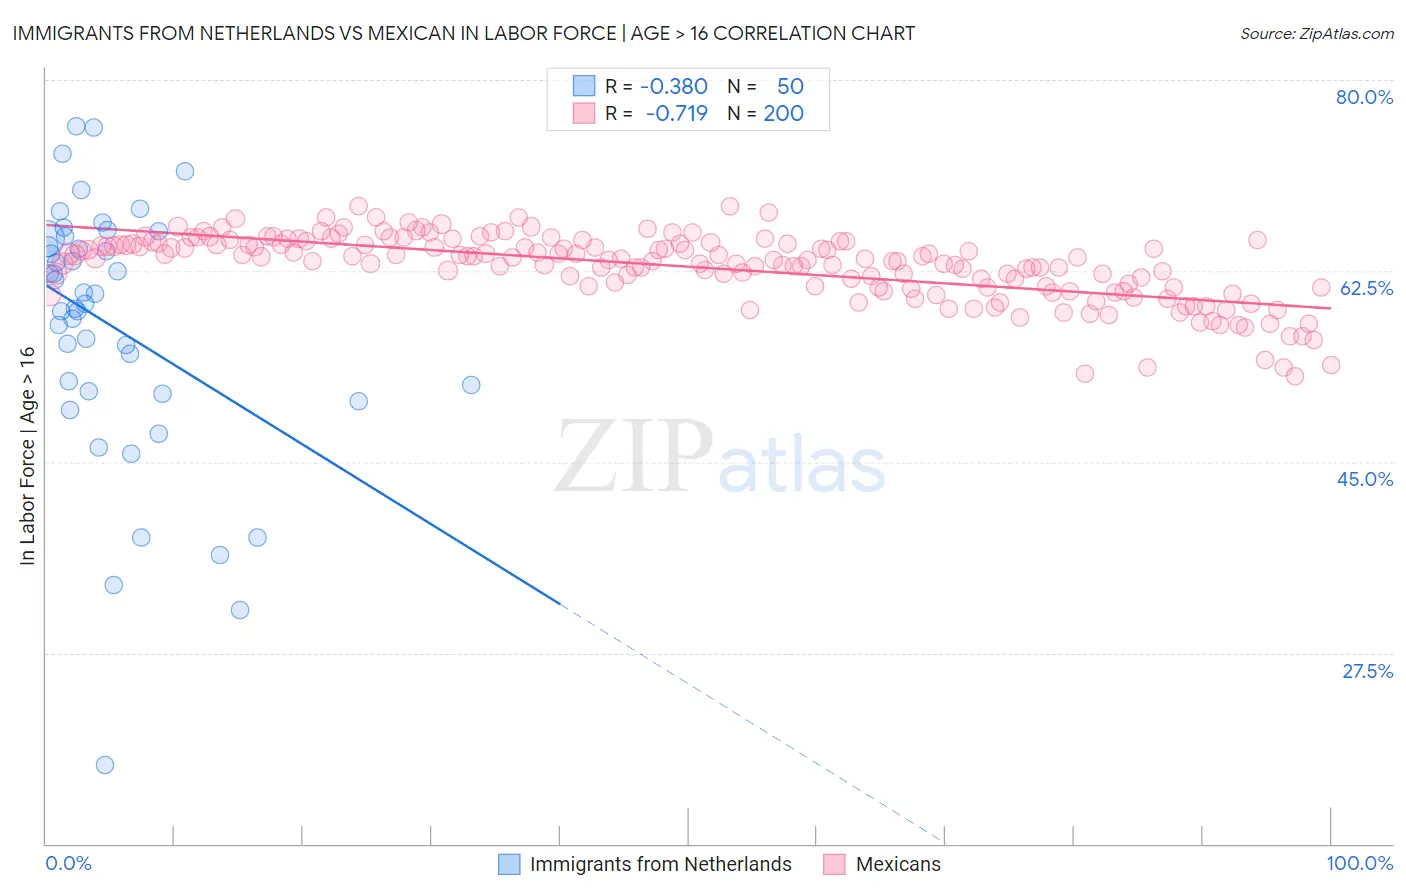
Immigrants from Netherlands vs Mexican In Labor Force | Age > 16 Correlation Chart
The statistical analysis conducted on geographies consisting of 237,884,135 people shows a mild negative correlation between the proportion of Immigrants from Netherlands and labor force participation rate among population ages 16 and over in the United States with a correlation coefficient (R) of -0.380 and weighted average of 64.5%. Similarly, the statistical analysis conducted on geographies consisting of 565,326,570 people shows a strong negative correlation between the proportion of Mexicans and labor force participation rate among population ages 16 and over in the United States with a correlation coefficient (R) of -0.719 and weighted average of 64.1%, a difference of 0.69%.
In Labor Force | Age > 16 Correlation Summary
| Measurement | Immigrants from Netherlands | Mexican |
| Minimum | 17.2% | 52.8% |
| Maximum | 75.8% | 68.4% |
| Range | 58.5% | 15.6% |
| Mean | 57.4% | 62.9% |
| Median | 60.0% | 63.7% |
| Interquartile 25% (IQ1) | 51.5% | 61.0% |
| Interquartile 75% (IQ3) | 65.4% | 65.0% |
| Interquartile Range (IQR) | 13.9% | 4.0% |
| Standard Deviation (Sample) | 11.9% | 3.1% |
| Standard Deviation (Population) | 11.8% | 3.1% |
Similar Demographics by In Labor Force | Age > 16
Demographics Similar to Immigrants from Netherlands by In Labor Force | Age > 16
In terms of in labor force | age > 16, the demographic groups most similar to Immigrants from Netherlands are Immigrants from Dominica (64.5%, a difference of 0.010%), Immigrants from Lebanon (64.5%, a difference of 0.010%), Immigrants from Bangladesh (64.5%, a difference of 0.020%), Immigrants from Hungary (64.5%, a difference of 0.030%), and Tsimshian (64.5%, a difference of 0.030%).
| Demographics | Rating | Rank | In Labor Force | Age > 16 |
| Austrians | 4.6 /100 | #235 | Tragic 64.6% |
| Immigrants | Norway | 4.6 /100 | #236 | Tragic 64.6% |
| Italians | 4.6 /100 | #237 | Tragic 64.6% |
| Lebanese | 3.9 /100 | #238 | Tragic 64.5% |
| Immigrants | Hungary | 3.8 /100 | #239 | Tragic 64.5% |
| Immigrants | Bangladesh | 3.6 /100 | #240 | Tragic 64.5% |
| Immigrants | Dominica | 3.5 /100 | #241 | Tragic 64.5% |
| Immigrants | Netherlands | 3.4 /100 | #242 | Tragic 64.5% |
| Immigrants | Lebanon | 3.2 /100 | #243 | Tragic 64.5% |
| Tsimshian | 3.1 /100 | #244 | Tragic 64.5% |
| West Indians | 3.0 /100 | #245 | Tragic 64.5% |
| Immigrants | Caribbean | 2.3 /100 | #246 | Tragic 64.4% |
| Swiss | 2.1 /100 | #247 | Tragic 64.4% |
| Immigrants | Barbados | 2.1 /100 | #248 | Tragic 64.4% |
| Germans | 1.8 /100 | #249 | Tragic 64.4% |
Demographics Similar to Mexicans by In Labor Force | Age > 16
In terms of in labor force | age > 16, the demographic groups most similar to Mexicans are Immigrants from Cuba (64.1%, a difference of 0.0%), French American Indian (64.1%, a difference of 0.0%), Native Hawaiian (64.1%, a difference of 0.020%), Hmong (64.1%, a difference of 0.020%), and Immigrants from Bahamas (64.0%, a difference of 0.030%).
| Demographics | Rating | Rank | In Labor Force | Age > 16 |
| Spaniards | 0.5 /100 | #268 | Tragic 64.1% |
| Irish | 0.4 /100 | #269 | Tragic 64.1% |
| Guyanese | 0.4 /100 | #270 | Tragic 64.1% |
| Dominicans | 0.4 /100 | #271 | Tragic 64.1% |
| Native Hawaiians | 0.3 /100 | #272 | Tragic 64.1% |
| Hmong | 0.3 /100 | #273 | Tragic 64.1% |
| Immigrants | Cuba | 0.3 /100 | #274 | Tragic 64.1% |
| Mexicans | 0.3 /100 | #275 | Tragic 64.1% |
| French American Indians | 0.3 /100 | #276 | Tragic 64.1% |
| Immigrants | Bahamas | 0.3 /100 | #277 | Tragic 64.0% |
| Assyrians/Chaldeans/Syriacs | 0.3 /100 | #278 | Tragic 64.0% |
| Welsh | 0.2 /100 | #279 | Tragic 64.0% |
| Immigrants | St. Vincent and the Grenadines | 0.2 /100 | #280 | Tragic 64.0% |
| French Canadians | 0.2 /100 | #281 | Tragic 64.0% |
| Immigrants | Guyana | 0.2 /100 | #282 | Tragic 64.0% |