Immigrants from Netherlands vs Yakama In Labor Force | Age > 16
COMPARE
Immigrants from Netherlands
Yakama
In Labor Force | Age > 16
In Labor Force | Age > 16 Comparison
Immigrants from Netherlands
Yakama
64.5%
IN LABOR FORCE | AGE > 16
3.4/ 100
METRIC RATING
242nd/ 347
METRIC RANK
62.1%
IN LABOR FORCE | AGE > 16
0.0/ 100
METRIC RATING
320th/ 347
METRIC RANK
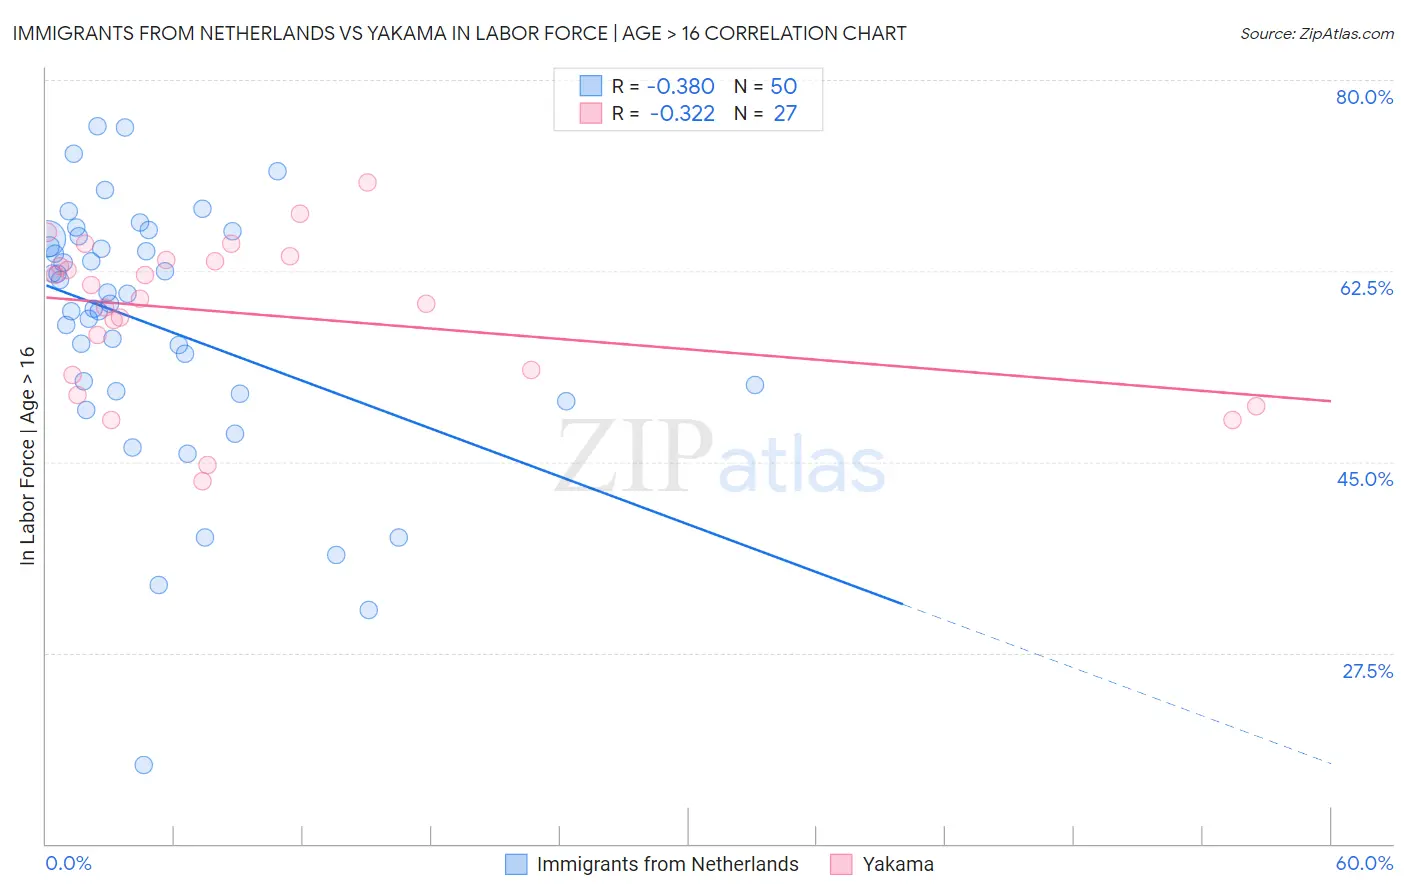
Immigrants from Netherlands vs Yakama In Labor Force | Age > 16 Correlation Chart
The statistical analysis conducted on geographies consisting of 237,884,135 people shows a mild negative correlation between the proportion of Immigrants from Netherlands and labor force participation rate among population ages 16 and over in the United States with a correlation coefficient (R) of -0.380 and weighted average of 64.5%. Similarly, the statistical analysis conducted on geographies consisting of 19,917,879 people shows a mild negative correlation between the proportion of Yakama and labor force participation rate among population ages 16 and over in the United States with a correlation coefficient (R) of -0.322 and weighted average of 62.1%, a difference of 3.8%.
In Labor Force | Age > 16 Correlation Summary
| Measurement | Immigrants from Netherlands | Yakama |
| Minimum | 17.2% | 43.2% |
| Maximum | 75.8% | 70.6% |
| Range | 58.5% | 27.4% |
| Mean | 57.4% | 58.5% |
| Median | 60.0% | 59.9% |
| Interquartile 25% (IQ1) | 51.5% | 53.0% |
| Interquartile 75% (IQ3) | 65.4% | 63.5% |
| Interquartile Range (IQR) | 13.9% | 10.5% |
| Standard Deviation (Sample) | 11.9% | 7.1% |
| Standard Deviation (Population) | 11.8% | 7.0% |
Similar Demographics by In Labor Force | Age > 16
Demographics Similar to Immigrants from Netherlands by In Labor Force | Age > 16
In terms of in labor force | age > 16, the demographic groups most similar to Immigrants from Netherlands are Immigrants from Dominica (64.5%, a difference of 0.010%), Immigrants from Lebanon (64.5%, a difference of 0.010%), Immigrants from Bangladesh (64.5%, a difference of 0.020%), Immigrants from Hungary (64.5%, a difference of 0.030%), and Tsimshian (64.5%, a difference of 0.030%).
| Demographics | Rating | Rank | In Labor Force | Age > 16 |
| Austrians | 4.6 /100 | #235 | Tragic 64.6% |
| Immigrants | Norway | 4.6 /100 | #236 | Tragic 64.6% |
| Italians | 4.6 /100 | #237 | Tragic 64.6% |
| Lebanese | 3.9 /100 | #238 | Tragic 64.5% |
| Immigrants | Hungary | 3.8 /100 | #239 | Tragic 64.5% |
| Immigrants | Bangladesh | 3.6 /100 | #240 | Tragic 64.5% |
| Immigrants | Dominica | 3.5 /100 | #241 | Tragic 64.5% |
| Immigrants | Netherlands | 3.4 /100 | #242 | Tragic 64.5% |
| Immigrants | Lebanon | 3.2 /100 | #243 | Tragic 64.5% |
| Tsimshian | 3.1 /100 | #244 | Tragic 64.5% |
| West Indians | 3.0 /100 | #245 | Tragic 64.5% |
| Immigrants | Caribbean | 2.3 /100 | #246 | Tragic 64.4% |
| Swiss | 2.1 /100 | #247 | Tragic 64.4% |
| Immigrants | Barbados | 2.1 /100 | #248 | Tragic 64.4% |
| Germans | 1.8 /100 | #249 | Tragic 64.4% |
Demographics Similar to Yakama by In Labor Force | Age > 16
In terms of in labor force | age > 16, the demographic groups most similar to Yakama are Arapaho (62.1%, a difference of 0.0%), American (62.1%, a difference of 0.040%), Ottawa (62.0%, a difference of 0.19%), Seminole (62.0%, a difference of 0.22%), and Chickasaw (62.3%, a difference of 0.25%).
| Demographics | Rating | Rank | In Labor Force | Age > 16 |
| Chippewa | 0.0 /100 | #313 | Tragic 63.1% |
| Yaqui | 0.0 /100 | #314 | Tragic 63.0% |
| Potawatomi | 0.0 /100 | #315 | Tragic 62.8% |
| Yup'ik | 0.0 /100 | #316 | Tragic 62.7% |
| Kiowa | 0.0 /100 | #317 | Tragic 62.4% |
| Chickasaw | 0.0 /100 | #318 | Tragic 62.3% |
| Arapaho | 0.0 /100 | #319 | Tragic 62.1% |
| Yakama | 0.0 /100 | #320 | Tragic 62.1% |
| Americans | 0.0 /100 | #321 | Tragic 62.1% |
| Ottawa | 0.0 /100 | #322 | Tragic 62.0% |
| Seminole | 0.0 /100 | #323 | Tragic 62.0% |
| Cheyenne | 0.0 /100 | #324 | Tragic 62.0% |
| Cherokee | 0.0 /100 | #325 | Tragic 61.9% |
| Sioux | 0.0 /100 | #326 | Tragic 61.8% |
| Cajuns | 0.0 /100 | #327 | Tragic 61.8% |