Immigrants from Netherlands vs Mexican In Labor Force | Age 45-54
COMPARE
Immigrants from Netherlands
Mexican
In Labor Force | Age 45-54
In Labor Force | Age 45-54 Comparison
Immigrants from Netherlands
Mexicans
82.9%
IN LABOR FORCE | AGE 45-54
72.6/ 100
METRIC RATING
150th/ 347
METRIC RANK
79.8%
IN LABOR FORCE | AGE 45-54
0.0/ 100
METRIC RATING
311th/ 347
METRIC RANK
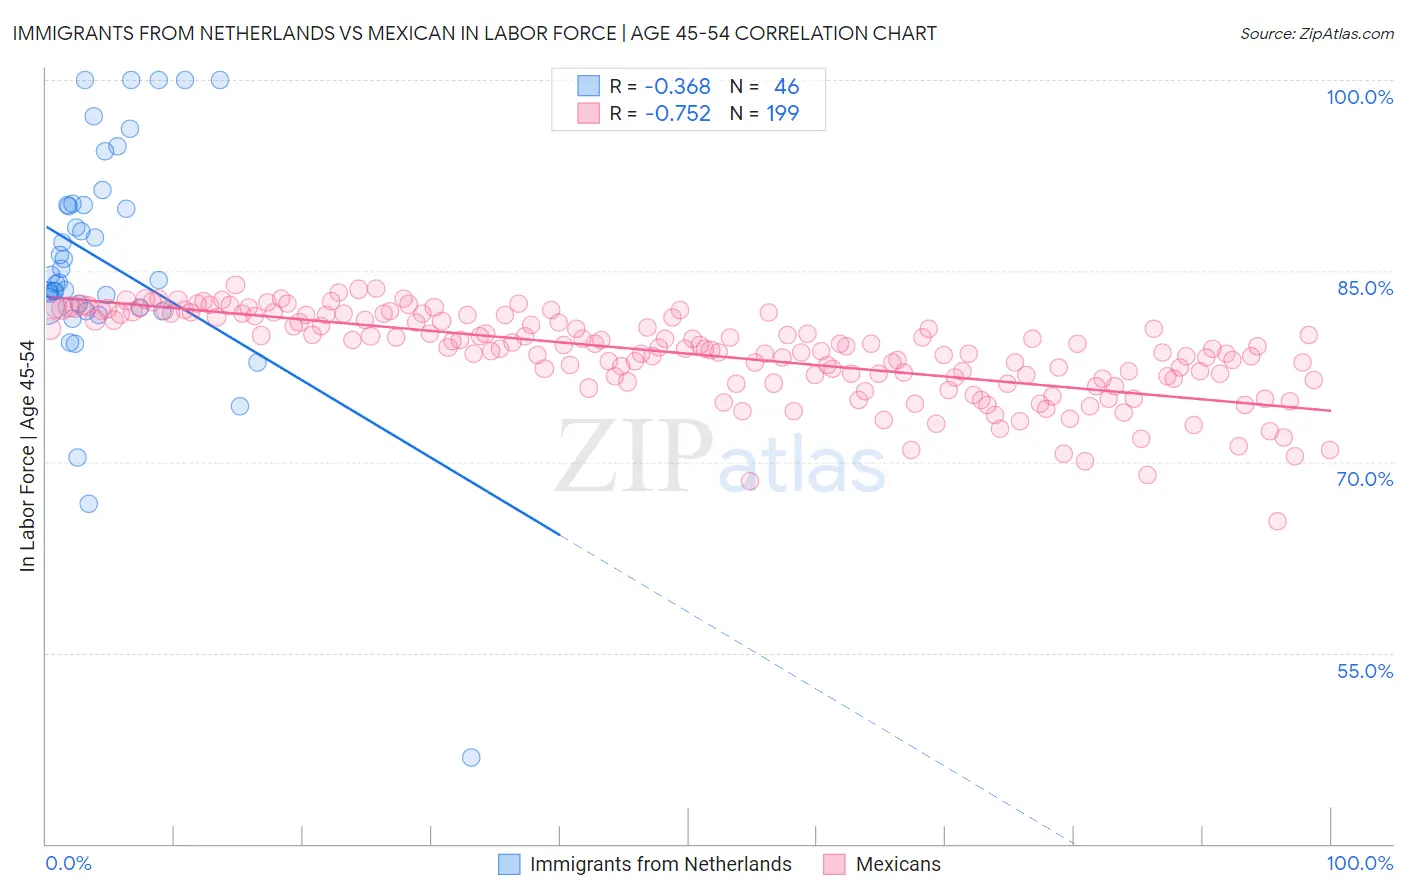
Immigrants from Netherlands vs Mexican In Labor Force | Age 45-54 Correlation Chart
The statistical analysis conducted on geographies consisting of 237,802,847 people shows a mild negative correlation between the proportion of Immigrants from Netherlands and labor force participation rate among population between the ages 45 and 54 in the United States with a correlation coefficient (R) of -0.368 and weighted average of 82.9%. Similarly, the statistical analysis conducted on geographies consisting of 564,480,863 people shows a strong negative correlation between the proportion of Mexicans and labor force participation rate among population between the ages 45 and 54 in the United States with a correlation coefficient (R) of -0.752 and weighted average of 79.8%, a difference of 3.9%.
In Labor Force | Age 45-54 Correlation Summary
| Measurement | Immigrants from Netherlands | Mexican |
| Minimum | 46.8% | 65.3% |
| Maximum | 100.0% | 83.9% |
| Range | 53.2% | 18.6% |
| Mean | 85.6% | 78.5% |
| Median | 84.5% | 79.0% |
| Interquartile 25% (IQ1) | 82.1% | 76.6% |
| Interquartile 75% (IQ3) | 90.2% | 81.5% |
| Interquartile Range (IQR) | 8.1% | 4.9% |
| Standard Deviation (Sample) | 9.5% | 3.4% |
| Standard Deviation (Population) | 9.4% | 3.4% |
Similar Demographics by In Labor Force | Age 45-54
Demographics Similar to Immigrants from Netherlands by In Labor Force | Age 45-54
In terms of in labor force | age 45-54, the demographic groups most similar to Immigrants from Netherlands are Immigrants from Sweden (82.9%, a difference of 0.010%), Korean (82.9%, a difference of 0.010%), Slavic (82.9%, a difference of 0.010%), Czechoslovakian (83.0%, a difference of 0.020%), and Immigrants from Nigeria (83.0%, a difference of 0.020%).
| Demographics | Rating | Rank | In Labor Force | Age 45-54 |
| Okinawans | 77.0 /100 | #143 | Good 83.0% |
| Soviet Union | 76.8 /100 | #144 | Good 83.0% |
| Romanians | 75.4 /100 | #145 | Good 83.0% |
| Immigrants | France | 75.3 /100 | #146 | Good 83.0% |
| Czechoslovakians | 74.8 /100 | #147 | Good 83.0% |
| Immigrants | Nigeria | 74.1 /100 | #148 | Good 83.0% |
| Immigrants | Sweden | 73.3 /100 | #149 | Good 82.9% |
| Immigrants | Netherlands | 72.6 /100 | #150 | Good 82.9% |
| Koreans | 71.9 /100 | #151 | Good 82.9% |
| Slavs | 71.5 /100 | #152 | Good 82.9% |
| Immigrants | Indonesia | 70.6 /100 | #153 | Good 82.9% |
| Immigrants | Ghana | 70.3 /100 | #154 | Good 82.9% |
| Immigrants | Philippines | 69.0 /100 | #155 | Good 82.9% |
| Immigrants | Saudi Arabia | 68.8 /100 | #156 | Good 82.9% |
| Immigrants | Australia | 68.2 /100 | #157 | Good 82.9% |
Demographics Similar to Mexicans by In Labor Force | Age 45-54
In terms of in labor force | age 45-54, the demographic groups most similar to Mexicans are Inupiat (79.9%, a difference of 0.11%), Immigrants from Mexico (79.7%, a difference of 0.14%), Potawatomi (80.0%, a difference of 0.20%), Central American Indian (80.0%, a difference of 0.22%), and Blackfeet (80.0%, a difference of 0.26%).
| Demographics | Rating | Rank | In Labor Force | Age 45-54 |
| Hispanics or Latinos | 0.0 /100 | #304 | Tragic 80.1% |
| Immigrants | Dominican Republic | 0.0 /100 | #305 | Tragic 80.1% |
| Spanish Americans | 0.0 /100 | #306 | Tragic 80.1% |
| Blackfeet | 0.0 /100 | #307 | Tragic 80.0% |
| Central American Indians | 0.0 /100 | #308 | Tragic 80.0% |
| Potawatomi | 0.0 /100 | #309 | Tragic 80.0% |
| Inupiat | 0.0 /100 | #310 | Tragic 79.9% |
| Mexicans | 0.0 /100 | #311 | Tragic 79.8% |
| Immigrants | Mexico | 0.0 /100 | #312 | Tragic 79.7% |
| Colville | 0.0 /100 | #313 | Tragic 79.5% |
| Ottawa | 0.0 /100 | #314 | Tragic 79.5% |
| Blacks/African Americans | 0.0 /100 | #315 | Tragic 79.3% |
| Shoshone | 0.0 /100 | #316 | Tragic 79.3% |
| Comanche | 0.0 /100 | #317 | Tragic 79.2% |
| Chickasaw | 0.0 /100 | #318 | Tragic 79.0% |