Immigrants from Netherlands vs Immigrants from Syria In Labor Force | Age 45-54
COMPARE
Immigrants from Netherlands
Immigrants from Syria
In Labor Force | Age 45-54
In Labor Force | Age 45-54 Comparison
Immigrants from Netherlands
Immigrants from Syria
82.9%
IN LABOR FORCE | AGE 45-54
72.6/ 100
METRIC RATING
150th/ 347
METRIC RANK
82.3%
IN LABOR FORCE | AGE 45-54
6.6/ 100
METRIC RATING
211th/ 347
METRIC RANK
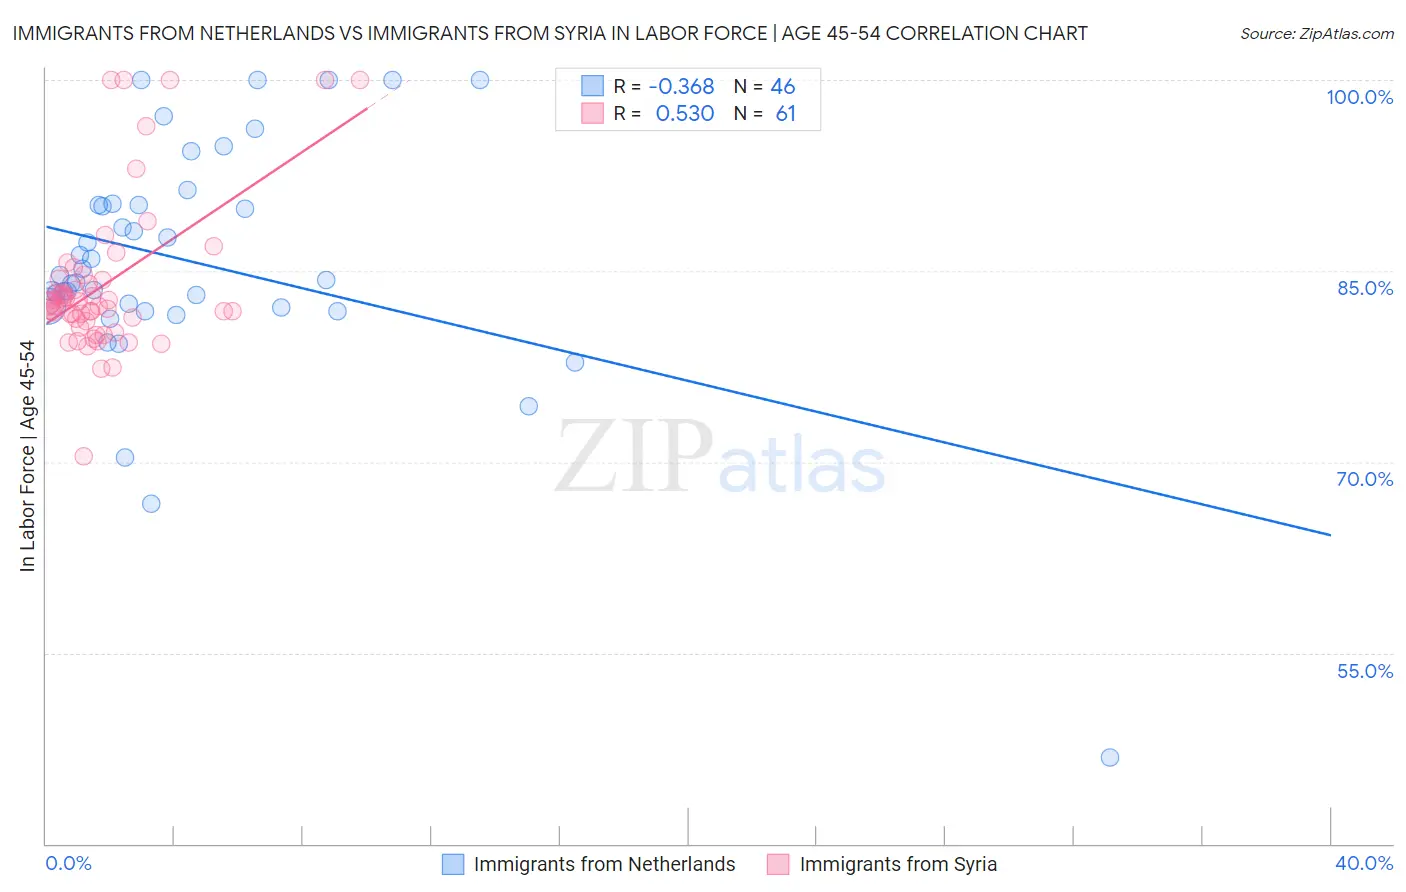
Immigrants from Netherlands vs Immigrants from Syria In Labor Force | Age 45-54 Correlation Chart
The statistical analysis conducted on geographies consisting of 237,802,847 people shows a mild negative correlation between the proportion of Immigrants from Netherlands and labor force participation rate among population between the ages 45 and 54 in the United States with a correlation coefficient (R) of -0.368 and weighted average of 82.9%. Similarly, the statistical analysis conducted on geographies consisting of 174,102,102 people shows a substantial positive correlation between the proportion of Immigrants from Syria and labor force participation rate among population between the ages 45 and 54 in the United States with a correlation coefficient (R) of 0.530 and weighted average of 82.3%, a difference of 0.80%.
In Labor Force | Age 45-54 Correlation Summary
| Measurement | Immigrants from Netherlands | Immigrants from Syria |
| Minimum | 46.8% | 70.4% |
| Maximum | 100.0% | 100.0% |
| Range | 53.2% | 29.6% |
| Mean | 85.6% | 83.9% |
| Median | 84.5% | 82.5% |
| Interquartile 25% (IQ1) | 82.1% | 81.2% |
| Interquartile 75% (IQ3) | 90.2% | 84.3% |
| Interquartile Range (IQR) | 8.1% | 3.1% |
| Standard Deviation (Sample) | 9.5% | 6.0% |
| Standard Deviation (Population) | 9.4% | 5.9% |
Similar Demographics by In Labor Force | Age 45-54
Demographics Similar to Immigrants from Netherlands by In Labor Force | Age 45-54
In terms of in labor force | age 45-54, the demographic groups most similar to Immigrants from Netherlands are Immigrants from Sweden (82.9%, a difference of 0.010%), Korean (82.9%, a difference of 0.010%), Slavic (82.9%, a difference of 0.010%), Czechoslovakian (83.0%, a difference of 0.020%), and Immigrants from Nigeria (83.0%, a difference of 0.020%).
| Demographics | Rating | Rank | In Labor Force | Age 45-54 |
| Okinawans | 77.0 /100 | #143 | Good 83.0% |
| Soviet Union | 76.8 /100 | #144 | Good 83.0% |
| Romanians | 75.4 /100 | #145 | Good 83.0% |
| Immigrants | France | 75.3 /100 | #146 | Good 83.0% |
| Czechoslovakians | 74.8 /100 | #147 | Good 83.0% |
| Immigrants | Nigeria | 74.1 /100 | #148 | Good 83.0% |
| Immigrants | Sweden | 73.3 /100 | #149 | Good 82.9% |
| Immigrants | Netherlands | 72.6 /100 | #150 | Good 82.9% |
| Koreans | 71.9 /100 | #151 | Good 82.9% |
| Slavs | 71.5 /100 | #152 | Good 82.9% |
| Immigrants | Indonesia | 70.6 /100 | #153 | Good 82.9% |
| Immigrants | Ghana | 70.3 /100 | #154 | Good 82.9% |
| Immigrants | Philippines | 69.0 /100 | #155 | Good 82.9% |
| Immigrants | Saudi Arabia | 68.8 /100 | #156 | Good 82.9% |
| Immigrants | Australia | 68.2 /100 | #157 | Good 82.9% |
Demographics Similar to Immigrants from Syria by In Labor Force | Age 45-54
In terms of in labor force | age 45-54, the demographic groups most similar to Immigrants from Syria are Ecuadorian (82.3%, a difference of 0.010%), Immigrants from Bahamas (82.3%, a difference of 0.020%), Immigrants from Lebanon (82.3%, a difference of 0.030%), Immigrants from Uzbekistan (82.3%, a difference of 0.030%), and Immigrants from Panama (82.2%, a difference of 0.040%).
| Demographics | Rating | Rank | In Labor Force | Age 45-54 |
| Immigrants | Western Europe | 10.9 /100 | #204 | Poor 82.4% |
| Senegalese | 9.5 /100 | #205 | Tragic 82.4% |
| Welsh | 9.2 /100 | #206 | Tragic 82.3% |
| Immigrants | Cabo Verde | 8.6 /100 | #207 | Tragic 82.3% |
| Native Hawaiians | 8.5 /100 | #208 | Tragic 82.3% |
| Immigrants | Lebanon | 7.4 /100 | #209 | Tragic 82.3% |
| Immigrants | Bahamas | 7.1 /100 | #210 | Tragic 82.3% |
| Immigrants | Syria | 6.6 /100 | #211 | Tragic 82.3% |
| Ecuadorians | 6.3 /100 | #212 | Tragic 82.3% |
| Immigrants | Uzbekistan | 5.8 /100 | #213 | Tragic 82.3% |
| Immigrants | Panama | 5.6 /100 | #214 | Tragic 82.2% |
| Iraqis | 5.6 /100 | #215 | Tragic 82.2% |
| Scottish | 5.3 /100 | #216 | Tragic 82.2% |
| Portuguese | 4.7 /100 | #217 | Tragic 82.2% |
| English | 4.4 /100 | #218 | Tragic 82.2% |