Immigrants from Micronesia vs Mexican In Labor Force | Age 45-54
COMPARE
Immigrants from Micronesia
Mexican
In Labor Force | Age 45-54
In Labor Force | Age 45-54 Comparison
Immigrants from Micronesia
Mexicans
81.1%
IN LABOR FORCE | AGE 45-54
0.0/ 100
METRIC RATING
279th/ 347
METRIC RANK
79.8%
IN LABOR FORCE | AGE 45-54
0.0/ 100
METRIC RATING
311th/ 347
METRIC RANK
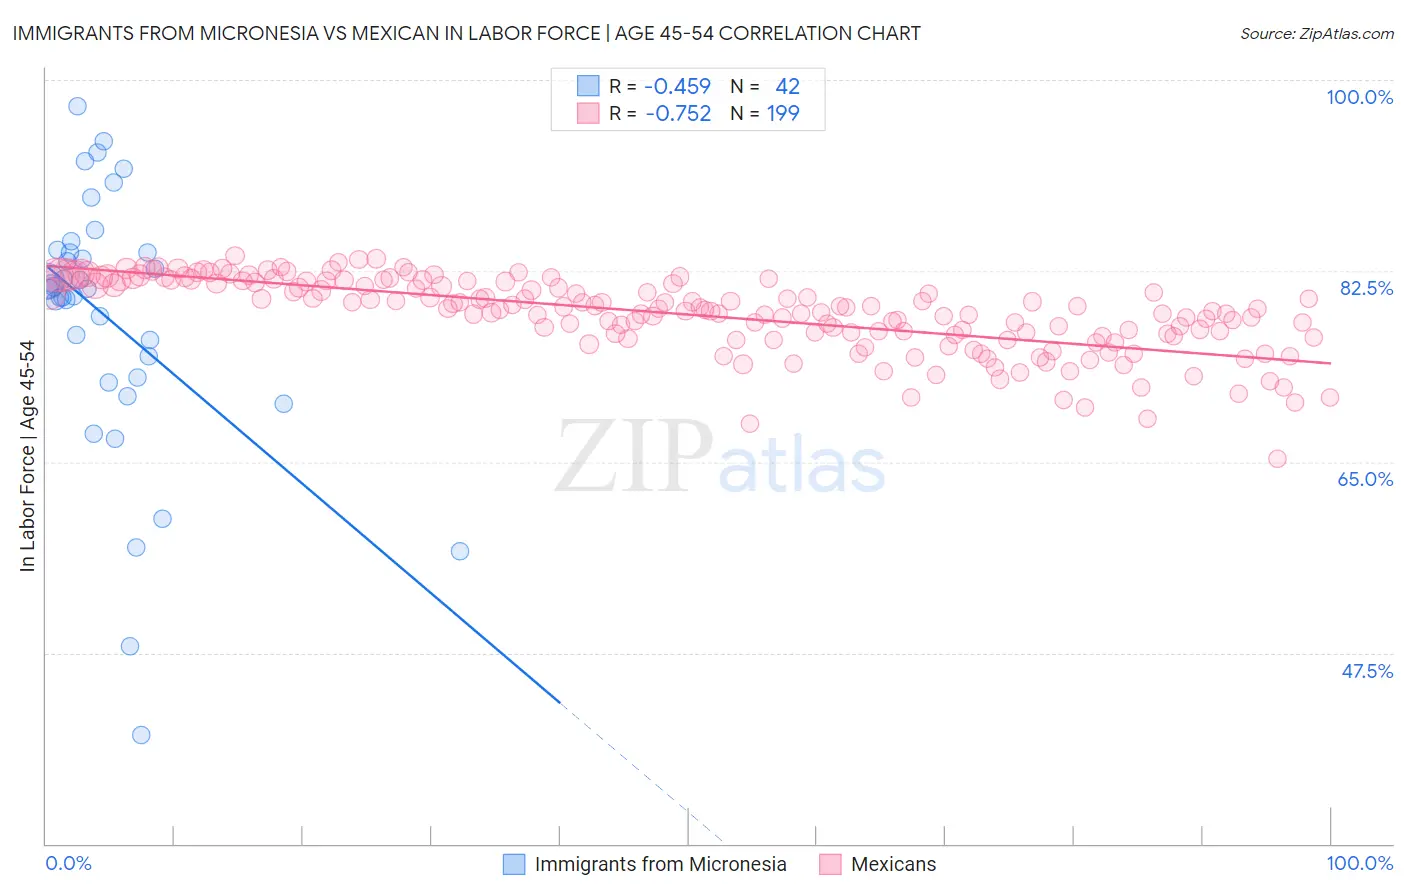
Immigrants from Micronesia vs Mexican In Labor Force | Age 45-54 Correlation Chart
The statistical analysis conducted on geographies consisting of 61,599,653 people shows a moderate negative correlation between the proportion of Immigrants from Micronesia and labor force participation rate among population between the ages 45 and 54 in the United States with a correlation coefficient (R) of -0.459 and weighted average of 81.1%. Similarly, the statistical analysis conducted on geographies consisting of 564,480,863 people shows a strong negative correlation between the proportion of Mexicans and labor force participation rate among population between the ages 45 and 54 in the United States with a correlation coefficient (R) of -0.752 and weighted average of 79.8%, a difference of 1.6%.
In Labor Force | Age 45-54 Correlation Summary
| Measurement | Immigrants from Micronesia | Mexican |
| Minimum | 40.0% | 65.3% |
| Maximum | 97.6% | 83.9% |
| Range | 57.6% | 18.6% |
| Mean | 78.1% | 78.5% |
| Median | 80.8% | 79.0% |
| Interquartile 25% (IQ1) | 72.7% | 76.6% |
| Interquartile 75% (IQ3) | 84.2% | 81.5% |
| Interquartile Range (IQR) | 11.5% | 4.9% |
| Standard Deviation (Sample) | 12.1% | 3.4% |
| Standard Deviation (Population) | 11.9% | 3.4% |
Similar Demographics by In Labor Force | Age 45-54
Demographics Similar to Immigrants from Micronesia by In Labor Force | Age 45-54
In terms of in labor force | age 45-54, the demographic groups most similar to Immigrants from Micronesia are Immigrants from Guatemala (81.1%, a difference of 0.010%), Guatemalan (81.2%, a difference of 0.090%), U.S. Virgin Islander (81.2%, a difference of 0.11%), Immigrants from Latin America (81.0%, a difference of 0.11%), and Immigrants from Grenada (81.0%, a difference of 0.11%).
| Demographics | Rating | Rank | In Labor Force | Age 45-54 |
| Spanish | 0.0 /100 | #272 | Tragic 81.3% |
| Chippewa | 0.0 /100 | #273 | Tragic 81.3% |
| British West Indians | 0.0 /100 | #274 | Tragic 81.2% |
| Immigrants | Nonimmigrants | 0.0 /100 | #275 | Tragic 81.2% |
| U.S. Virgin Islanders | 0.0 /100 | #276 | Tragic 81.2% |
| Guatemalans | 0.0 /100 | #277 | Tragic 81.2% |
| Immigrants | Guatemala | 0.0 /100 | #278 | Tragic 81.1% |
| Immigrants | Micronesia | 0.0 /100 | #279 | Tragic 81.1% |
| Immigrants | Latin America | 0.0 /100 | #280 | Tragic 81.0% |
| Immigrants | Grenada | 0.0 /100 | #281 | Tragic 81.0% |
| Aleuts | 0.0 /100 | #282 | Tragic 81.0% |
| French American Indians | 0.0 /100 | #283 | Tragic 80.8% |
| Belizeans | 0.0 /100 | #284 | Tragic 80.8% |
| Delaware | 0.0 /100 | #285 | Tragic 80.8% |
| Immigrants | Dominica | 0.0 /100 | #286 | Tragic 80.8% |
Demographics Similar to Mexicans by In Labor Force | Age 45-54
In terms of in labor force | age 45-54, the demographic groups most similar to Mexicans are Inupiat (79.9%, a difference of 0.11%), Immigrants from Mexico (79.7%, a difference of 0.14%), Potawatomi (80.0%, a difference of 0.20%), Central American Indian (80.0%, a difference of 0.22%), and Blackfeet (80.0%, a difference of 0.26%).
| Demographics | Rating | Rank | In Labor Force | Age 45-54 |
| Hispanics or Latinos | 0.0 /100 | #304 | Tragic 80.1% |
| Immigrants | Dominican Republic | 0.0 /100 | #305 | Tragic 80.1% |
| Spanish Americans | 0.0 /100 | #306 | Tragic 80.1% |
| Blackfeet | 0.0 /100 | #307 | Tragic 80.0% |
| Central American Indians | 0.0 /100 | #308 | Tragic 80.0% |
| Potawatomi | 0.0 /100 | #309 | Tragic 80.0% |
| Inupiat | 0.0 /100 | #310 | Tragic 79.9% |
| Mexicans | 0.0 /100 | #311 | Tragic 79.8% |
| Immigrants | Mexico | 0.0 /100 | #312 | Tragic 79.7% |
| Colville | 0.0 /100 | #313 | Tragic 79.5% |
| Ottawa | 0.0 /100 | #314 | Tragic 79.5% |
| Blacks/African Americans | 0.0 /100 | #315 | Tragic 79.3% |
| Shoshone | 0.0 /100 | #316 | Tragic 79.3% |
| Comanche | 0.0 /100 | #317 | Tragic 79.2% |
| Chickasaw | 0.0 /100 | #318 | Tragic 79.0% |