Maltese vs Mexican In Labor Force | Age 45-54
COMPARE
Maltese
Mexican
In Labor Force | Age 45-54
In Labor Force | Age 45-54 Comparison
Maltese
Mexicans
83.3%
IN LABOR FORCE | AGE 45-54
94.4/ 100
METRIC RATING
98th/ 347
METRIC RANK
79.8%
IN LABOR FORCE | AGE 45-54
0.0/ 100
METRIC RATING
311th/ 347
METRIC RANK
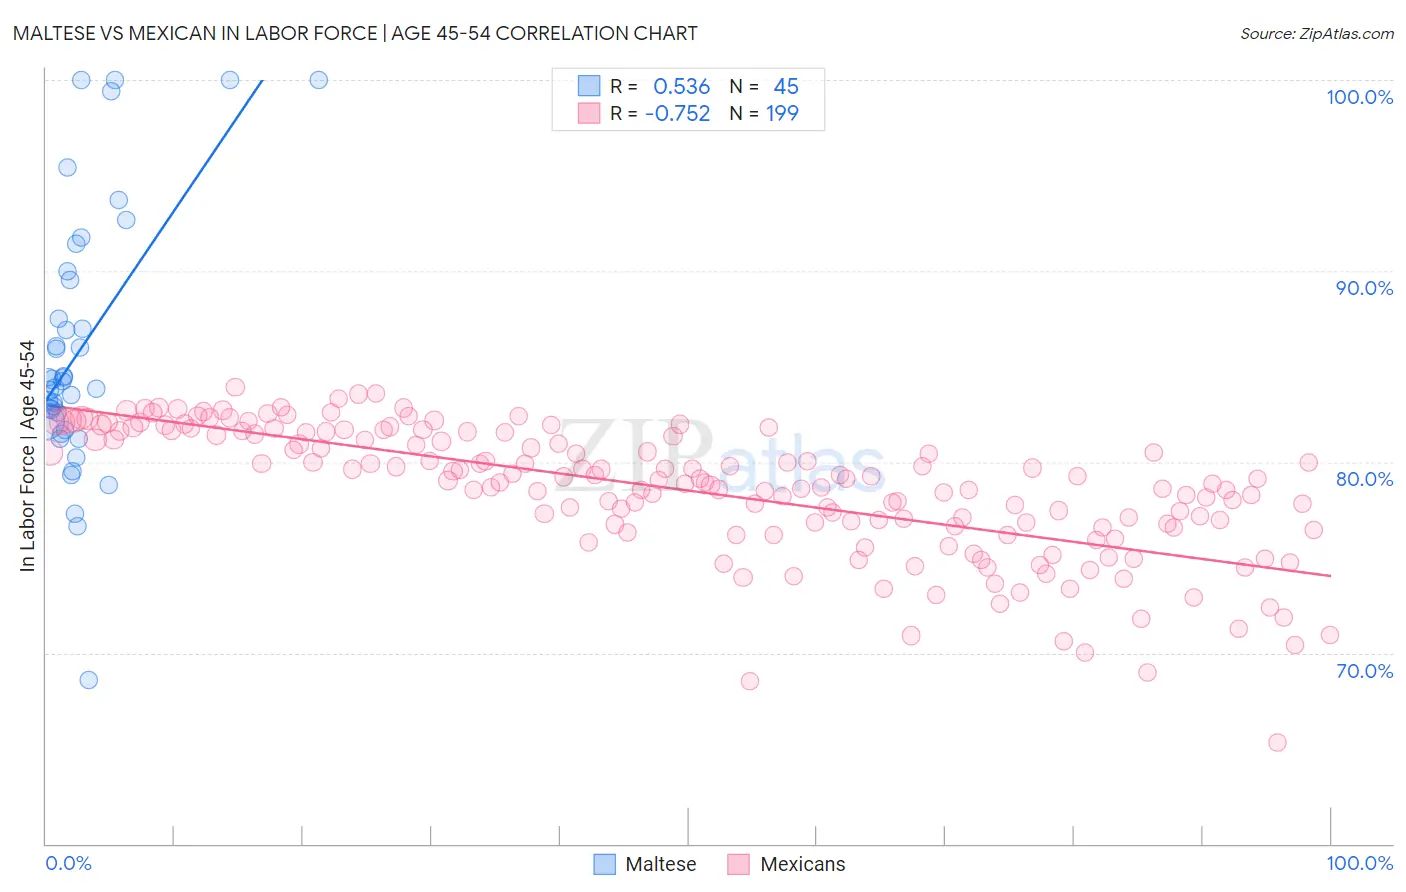
Maltese vs Mexican In Labor Force | Age 45-54 Correlation Chart
The statistical analysis conducted on geographies consisting of 126,435,946 people shows a substantial positive correlation between the proportion of Maltese and labor force participation rate among population between the ages 45 and 54 in the United States with a correlation coefficient (R) of 0.536 and weighted average of 83.3%. Similarly, the statistical analysis conducted on geographies consisting of 564,480,863 people shows a strong negative correlation between the proportion of Mexicans and labor force participation rate among population between the ages 45 and 54 in the United States with a correlation coefficient (R) of -0.752 and weighted average of 79.8%, a difference of 4.4%.
In Labor Force | Age 45-54 Correlation Summary
| Measurement | Maltese | Mexican |
| Minimum | 68.6% | 65.3% |
| Maximum | 100.0% | 83.9% |
| Range | 31.4% | 18.6% |
| Mean | 85.9% | 78.5% |
| Median | 84.2% | 79.0% |
| Interquartile 25% (IQ1) | 81.9% | 76.6% |
| Interquartile 75% (IQ3) | 89.8% | 81.5% |
| Interquartile Range (IQR) | 7.9% | 4.9% |
| Standard Deviation (Sample) | 6.9% | 3.4% |
| Standard Deviation (Population) | 6.8% | 3.4% |
Similar Demographics by In Labor Force | Age 45-54
Demographics Similar to Maltese by In Labor Force | Age 45-54
In terms of in labor force | age 45-54, the demographic groups most similar to Maltese are Palestinian (83.3%, a difference of 0.010%), Immigrants from Middle Africa (83.3%, a difference of 0.010%), Mongolian (83.3%, a difference of 0.010%), Immigrants from Belarus (83.3%, a difference of 0.010%), and Argentinean (83.3%, a difference of 0.020%).
| Demographics | Rating | Rank | In Labor Force | Age 45-54 |
| South Americans | 95.5 /100 | #91 | Exceptional 83.3% |
| Danes | 95.3 /100 | #92 | Exceptional 83.3% |
| Italians | 95.1 /100 | #93 | Exceptional 83.3% |
| Argentineans | 94.9 /100 | #94 | Exceptional 83.3% |
| Immigrants | Argentina | 94.9 /100 | #95 | Exceptional 83.3% |
| Immigrants | Kuwait | 94.8 /100 | #96 | Exceptional 83.3% |
| Palestinians | 94.8 /100 | #97 | Exceptional 83.3% |
| Maltese | 94.4 /100 | #98 | Exceptional 83.3% |
| Immigrants | Middle Africa | 94.3 /100 | #99 | Exceptional 83.3% |
| Mongolians | 94.2 /100 | #100 | Exceptional 83.3% |
| Immigrants | Belarus | 94.1 /100 | #101 | Exceptional 83.3% |
| Immigrants | Singapore | 93.9 /100 | #102 | Exceptional 83.3% |
| Albanians | 93.9 /100 | #103 | Exceptional 83.3% |
| Immigrants | Romania | 93.8 /100 | #104 | Exceptional 83.3% |
| Immigrants | South America | 93.5 /100 | #105 | Exceptional 83.2% |
Demographics Similar to Mexicans by In Labor Force | Age 45-54
In terms of in labor force | age 45-54, the demographic groups most similar to Mexicans are Inupiat (79.9%, a difference of 0.11%), Immigrants from Mexico (79.7%, a difference of 0.14%), Potawatomi (80.0%, a difference of 0.20%), Central American Indian (80.0%, a difference of 0.22%), and Blackfeet (80.0%, a difference of 0.26%).
| Demographics | Rating | Rank | In Labor Force | Age 45-54 |
| Hispanics or Latinos | 0.0 /100 | #304 | Tragic 80.1% |
| Immigrants | Dominican Republic | 0.0 /100 | #305 | Tragic 80.1% |
| Spanish Americans | 0.0 /100 | #306 | Tragic 80.1% |
| Blackfeet | 0.0 /100 | #307 | Tragic 80.0% |
| Central American Indians | 0.0 /100 | #308 | Tragic 80.0% |
| Potawatomi | 0.0 /100 | #309 | Tragic 80.0% |
| Inupiat | 0.0 /100 | #310 | Tragic 79.9% |
| Mexicans | 0.0 /100 | #311 | Tragic 79.8% |
| Immigrants | Mexico | 0.0 /100 | #312 | Tragic 79.7% |
| Colville | 0.0 /100 | #313 | Tragic 79.5% |
| Ottawa | 0.0 /100 | #314 | Tragic 79.5% |
| Blacks/African Americans | 0.0 /100 | #315 | Tragic 79.3% |
| Shoshone | 0.0 /100 | #316 | Tragic 79.3% |
| Comanche | 0.0 /100 | #317 | Tragic 79.2% |
| Chickasaw | 0.0 /100 | #318 | Tragic 79.0% |