Immigrants from Netherlands vs Immigrants from Belarus In Labor Force | Age 45-54
COMPARE
Immigrants from Netherlands
Immigrants from Belarus
In Labor Force | Age 45-54
In Labor Force | Age 45-54 Comparison
Immigrants from Netherlands
Immigrants from Belarus
82.9%
IN LABOR FORCE | AGE 45-54
72.6/ 100
METRIC RATING
150th/ 347
METRIC RANK
83.3%
IN LABOR FORCE | AGE 45-54
94.1/ 100
METRIC RATING
101st/ 347
METRIC RANK
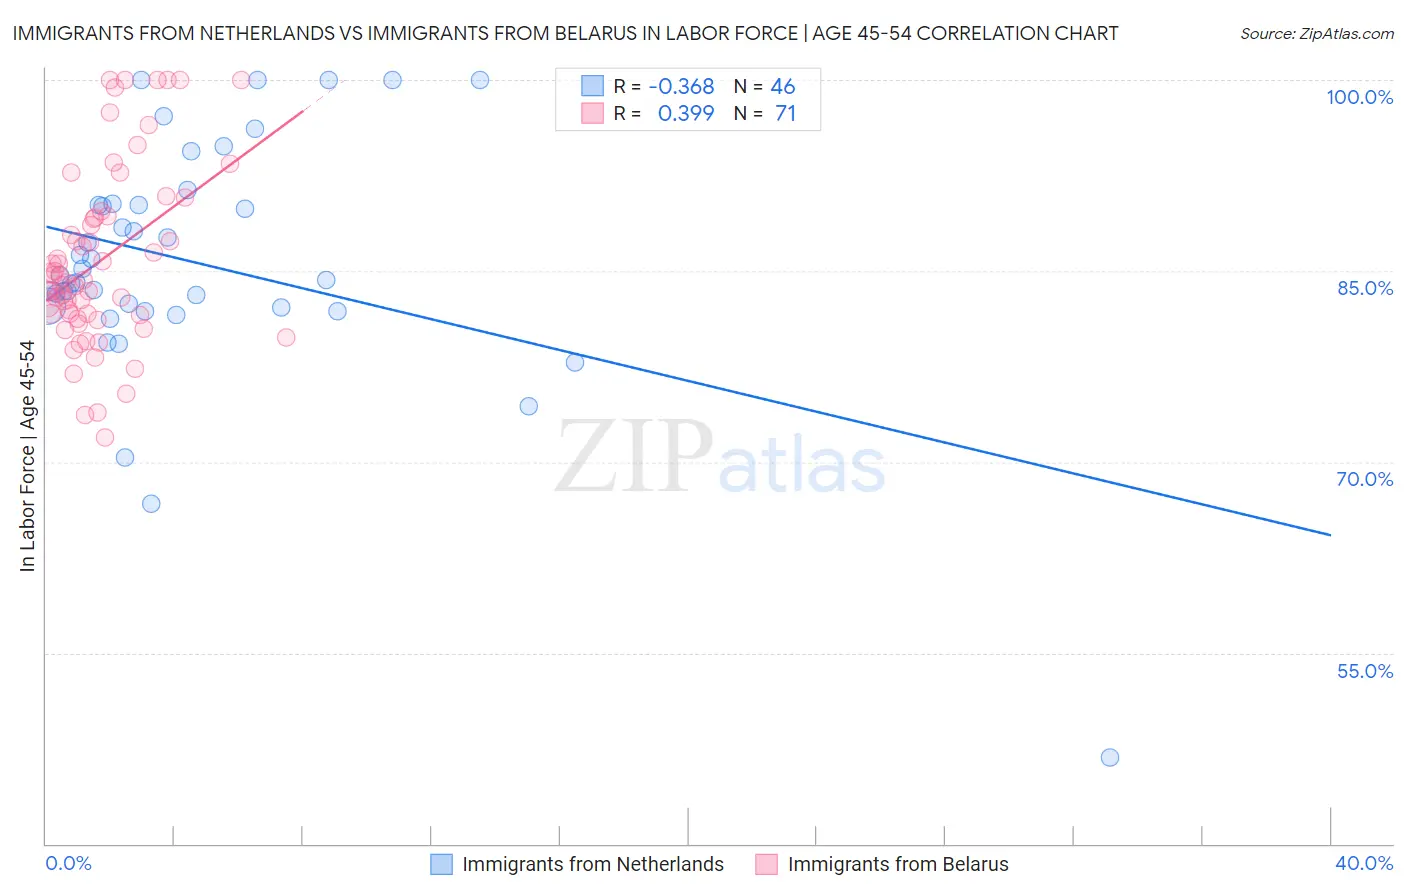
Immigrants from Netherlands vs Immigrants from Belarus In Labor Force | Age 45-54 Correlation Chart
The statistical analysis conducted on geographies consisting of 237,802,847 people shows a mild negative correlation between the proportion of Immigrants from Netherlands and labor force participation rate among population between the ages 45 and 54 in the United States with a correlation coefficient (R) of -0.368 and weighted average of 82.9%. Similarly, the statistical analysis conducted on geographies consisting of 150,181,664 people shows a mild positive correlation between the proportion of Immigrants from Belarus and labor force participation rate among population between the ages 45 and 54 in the United States with a correlation coefficient (R) of 0.399 and weighted average of 83.3%, a difference of 0.39%.
In Labor Force | Age 45-54 Correlation Summary
| Measurement | Immigrants from Netherlands | Immigrants from Belarus |
| Minimum | 46.8% | 71.9% |
| Maximum | 100.0% | 100.0% |
| Range | 53.2% | 28.1% |
| Mean | 85.6% | 85.9% |
| Median | 84.5% | 84.3% |
| Interquartile 25% (IQ1) | 82.1% | 81.5% |
| Interquartile 75% (IQ3) | 90.2% | 89.3% |
| Interquartile Range (IQR) | 8.1% | 7.8% |
| Standard Deviation (Sample) | 9.5% | 6.9% |
| Standard Deviation (Population) | 9.4% | 6.9% |
Similar Demographics by In Labor Force | Age 45-54
Demographics Similar to Immigrants from Netherlands by In Labor Force | Age 45-54
In terms of in labor force | age 45-54, the demographic groups most similar to Immigrants from Netherlands are Immigrants from Sweden (82.9%, a difference of 0.010%), Korean (82.9%, a difference of 0.010%), Slavic (82.9%, a difference of 0.010%), Czechoslovakian (83.0%, a difference of 0.020%), and Immigrants from Nigeria (83.0%, a difference of 0.020%).
| Demographics | Rating | Rank | In Labor Force | Age 45-54 |
| Okinawans | 77.0 /100 | #143 | Good 83.0% |
| Soviet Union | 76.8 /100 | #144 | Good 83.0% |
| Romanians | 75.4 /100 | #145 | Good 83.0% |
| Immigrants | France | 75.3 /100 | #146 | Good 83.0% |
| Czechoslovakians | 74.8 /100 | #147 | Good 83.0% |
| Immigrants | Nigeria | 74.1 /100 | #148 | Good 83.0% |
| Immigrants | Sweden | 73.3 /100 | #149 | Good 82.9% |
| Immigrants | Netherlands | 72.6 /100 | #150 | Good 82.9% |
| Koreans | 71.9 /100 | #151 | Good 82.9% |
| Slavs | 71.5 /100 | #152 | Good 82.9% |
| Immigrants | Indonesia | 70.6 /100 | #153 | Good 82.9% |
| Immigrants | Ghana | 70.3 /100 | #154 | Good 82.9% |
| Immigrants | Philippines | 69.0 /100 | #155 | Good 82.9% |
| Immigrants | Saudi Arabia | 68.8 /100 | #156 | Good 82.9% |
| Immigrants | Australia | 68.2 /100 | #157 | Good 82.9% |
Demographics Similar to Immigrants from Belarus by In Labor Force | Age 45-54
In terms of in labor force | age 45-54, the demographic groups most similar to Immigrants from Belarus are Mongolian (83.3%, a difference of 0.0%), Maltese (83.3%, a difference of 0.010%), Immigrants from Middle Africa (83.3%, a difference of 0.010%), Immigrants from Singapore (83.3%, a difference of 0.010%), and Albanian (83.3%, a difference of 0.010%).
| Demographics | Rating | Rank | In Labor Force | Age 45-54 |
| Argentineans | 94.9 /100 | #94 | Exceptional 83.3% |
| Immigrants | Argentina | 94.9 /100 | #95 | Exceptional 83.3% |
| Immigrants | Kuwait | 94.8 /100 | #96 | Exceptional 83.3% |
| Palestinians | 94.8 /100 | #97 | Exceptional 83.3% |
| Maltese | 94.4 /100 | #98 | Exceptional 83.3% |
| Immigrants | Middle Africa | 94.3 /100 | #99 | Exceptional 83.3% |
| Mongolians | 94.2 /100 | #100 | Exceptional 83.3% |
| Immigrants | Belarus | 94.1 /100 | #101 | Exceptional 83.3% |
| Immigrants | Singapore | 93.9 /100 | #102 | Exceptional 83.3% |
| Albanians | 93.9 /100 | #103 | Exceptional 83.3% |
| Immigrants | Romania | 93.8 /100 | #104 | Exceptional 83.3% |
| Immigrants | South America | 93.5 /100 | #105 | Exceptional 83.2% |
| Sri Lankans | 93.2 /100 | #106 | Exceptional 83.2% |
| Iranians | 92.9 /100 | #107 | Exceptional 83.2% |
| Slovaks | 92.8 /100 | #108 | Exceptional 83.2% |