Immigrants from Netherlands vs Tohono O'odham In Labor Force | Age 45-54
COMPARE
Immigrants from Netherlands
Tohono O'odham
In Labor Force | Age 45-54
In Labor Force | Age 45-54 Comparison
Immigrants from Netherlands
Tohono O'odham
82.9%
IN LABOR FORCE | AGE 45-54
72.6/ 100
METRIC RATING
150th/ 347
METRIC RANK
75.1%
IN LABOR FORCE | AGE 45-54
0.0/ 100
METRIC RATING
342nd/ 347
METRIC RANK
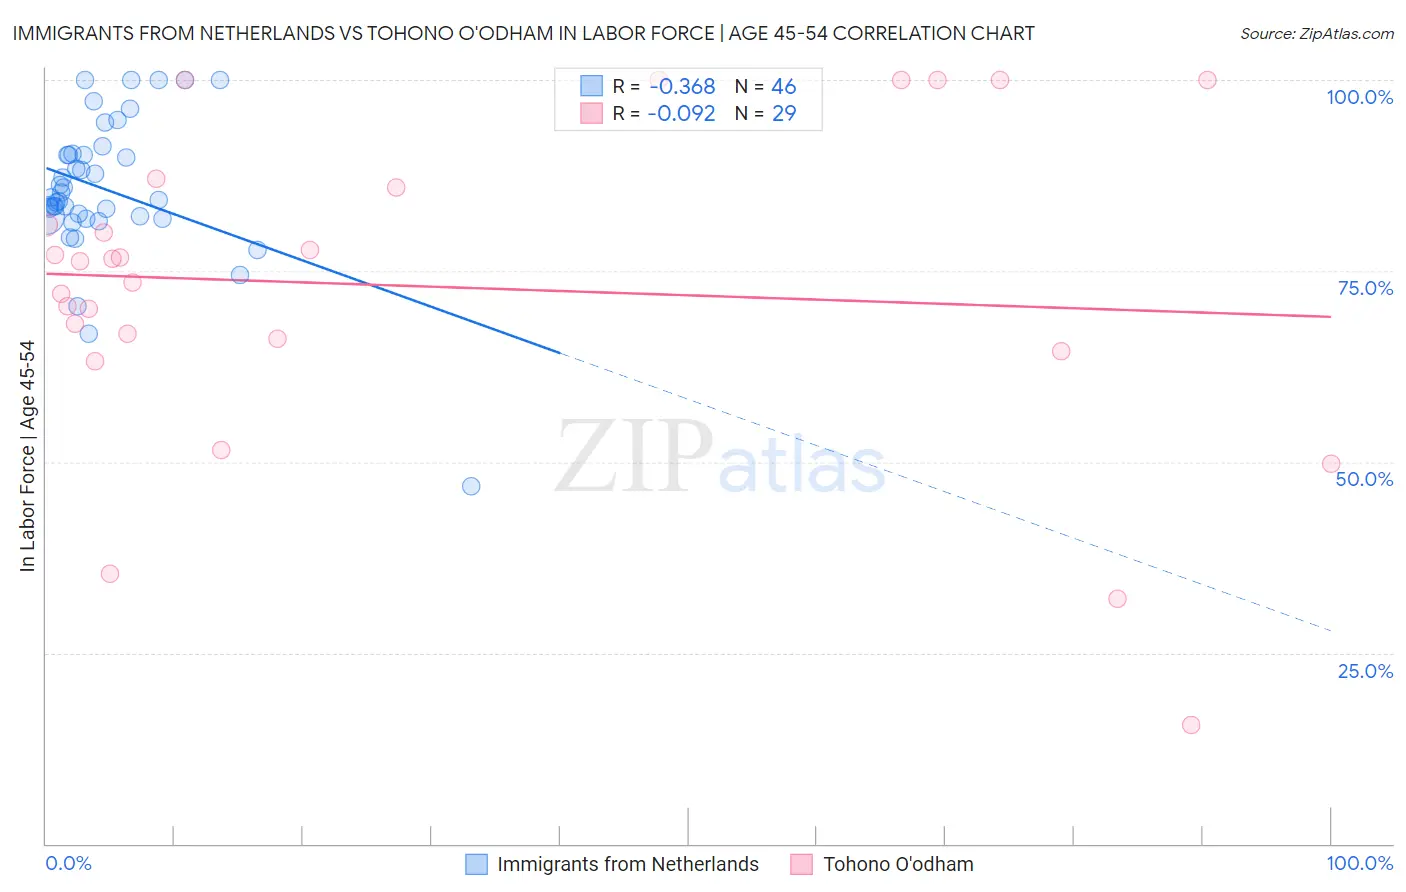
Immigrants from Netherlands vs Tohono O'odham In Labor Force | Age 45-54 Correlation Chart
The statistical analysis conducted on geographies consisting of 237,802,847 people shows a mild negative correlation between the proportion of Immigrants from Netherlands and labor force participation rate among population between the ages 45 and 54 in the United States with a correlation coefficient (R) of -0.368 and weighted average of 82.9%. Similarly, the statistical analysis conducted on geographies consisting of 58,717,652 people shows a slight negative correlation between the proportion of Tohono O'odham and labor force participation rate among population between the ages 45 and 54 in the United States with a correlation coefficient (R) of -0.092 and weighted average of 75.1%, a difference of 10.4%.
In Labor Force | Age 45-54 Correlation Summary
| Measurement | Immigrants from Netherlands | Tohono O'odham |
| Minimum | 46.8% | 15.5% |
| Maximum | 100.0% | 100.0% |
| Range | 53.2% | 84.5% |
| Mean | 85.6% | 73.0% |
| Median | 84.5% | 76.2% |
| Interquartile 25% (IQ1) | 82.1% | 65.3% |
| Interquartile 75% (IQ3) | 90.2% | 86.5% |
| Interquartile Range (IQR) | 8.1% | 21.2% |
| Standard Deviation (Sample) | 9.5% | 21.2% |
| Standard Deviation (Population) | 9.4% | 20.9% |
Similar Demographics by In Labor Force | Age 45-54
Demographics Similar to Immigrants from Netherlands by In Labor Force | Age 45-54
In terms of in labor force | age 45-54, the demographic groups most similar to Immigrants from Netherlands are Immigrants from Sweden (82.9%, a difference of 0.010%), Korean (82.9%, a difference of 0.010%), Slavic (82.9%, a difference of 0.010%), Czechoslovakian (83.0%, a difference of 0.020%), and Immigrants from Nigeria (83.0%, a difference of 0.020%).
| Demographics | Rating | Rank | In Labor Force | Age 45-54 |
| Okinawans | 77.0 /100 | #143 | Good 83.0% |
| Soviet Union | 76.8 /100 | #144 | Good 83.0% |
| Romanians | 75.4 /100 | #145 | Good 83.0% |
| Immigrants | France | 75.3 /100 | #146 | Good 83.0% |
| Czechoslovakians | 74.8 /100 | #147 | Good 83.0% |
| Immigrants | Nigeria | 74.1 /100 | #148 | Good 83.0% |
| Immigrants | Sweden | 73.3 /100 | #149 | Good 82.9% |
| Immigrants | Netherlands | 72.6 /100 | #150 | Good 82.9% |
| Koreans | 71.9 /100 | #151 | Good 82.9% |
| Slavs | 71.5 /100 | #152 | Good 82.9% |
| Immigrants | Indonesia | 70.6 /100 | #153 | Good 82.9% |
| Immigrants | Ghana | 70.3 /100 | #154 | Good 82.9% |
| Immigrants | Philippines | 69.0 /100 | #155 | Good 82.9% |
| Immigrants | Saudi Arabia | 68.8 /100 | #156 | Good 82.9% |
| Immigrants | Australia | 68.2 /100 | #157 | Good 82.9% |
Demographics Similar to Tohono O'odham by In Labor Force | Age 45-54
In terms of in labor force | age 45-54, the demographic groups most similar to Tohono O'odham are Hopi (75.0%, a difference of 0.18%), Pueblo (75.5%, a difference of 0.49%), Lumbee (75.6%, a difference of 0.61%), Immigrants from Yemen (74.4%, a difference of 0.96%), and Puerto Rican (75.9%, a difference of 1.1%).
| Demographics | Rating | Rank | In Labor Force | Age 45-54 |
| Natives/Alaskans | 0.0 /100 | #333 | Tragic 77.1% |
| Apache | 0.0 /100 | #334 | Tragic 77.1% |
| Arapaho | 0.0 /100 | #335 | Tragic 77.1% |
| Paiute | 0.0 /100 | #336 | Tragic 76.7% |
| Ute | 0.0 /100 | #337 | Tragic 76.6% |
| Yuman | 0.0 /100 | #338 | Tragic 76.3% |
| Puerto Ricans | 0.0 /100 | #339 | Tragic 75.9% |
| Lumbee | 0.0 /100 | #340 | Tragic 75.6% |
| Pueblo | 0.0 /100 | #341 | Tragic 75.5% |
| Tohono O'odham | 0.0 /100 | #342 | Tragic 75.1% |
| Hopi | 0.0 /100 | #343 | Tragic 75.0% |
| Immigrants | Yemen | 0.0 /100 | #344 | Tragic 74.4% |
| Houma | 0.0 /100 | #345 | Tragic 74.1% |
| Pima | 0.0 /100 | #346 | Tragic 72.8% |
| Navajo | 0.0 /100 | #347 | Tragic 72.8% |