Tsimshian vs Mexican In Labor Force | Age 45-54
COMPARE
Tsimshian
Mexican
In Labor Force | Age 45-54
In Labor Force | Age 45-54 Comparison
Tsimshian
Mexicans
77.4%
IN LABOR FORCE | AGE 45-54
0.0/ 100
METRIC RATING
331st/ 347
METRIC RANK
79.8%
IN LABOR FORCE | AGE 45-54
0.0/ 100
METRIC RATING
311th/ 347
METRIC RANK
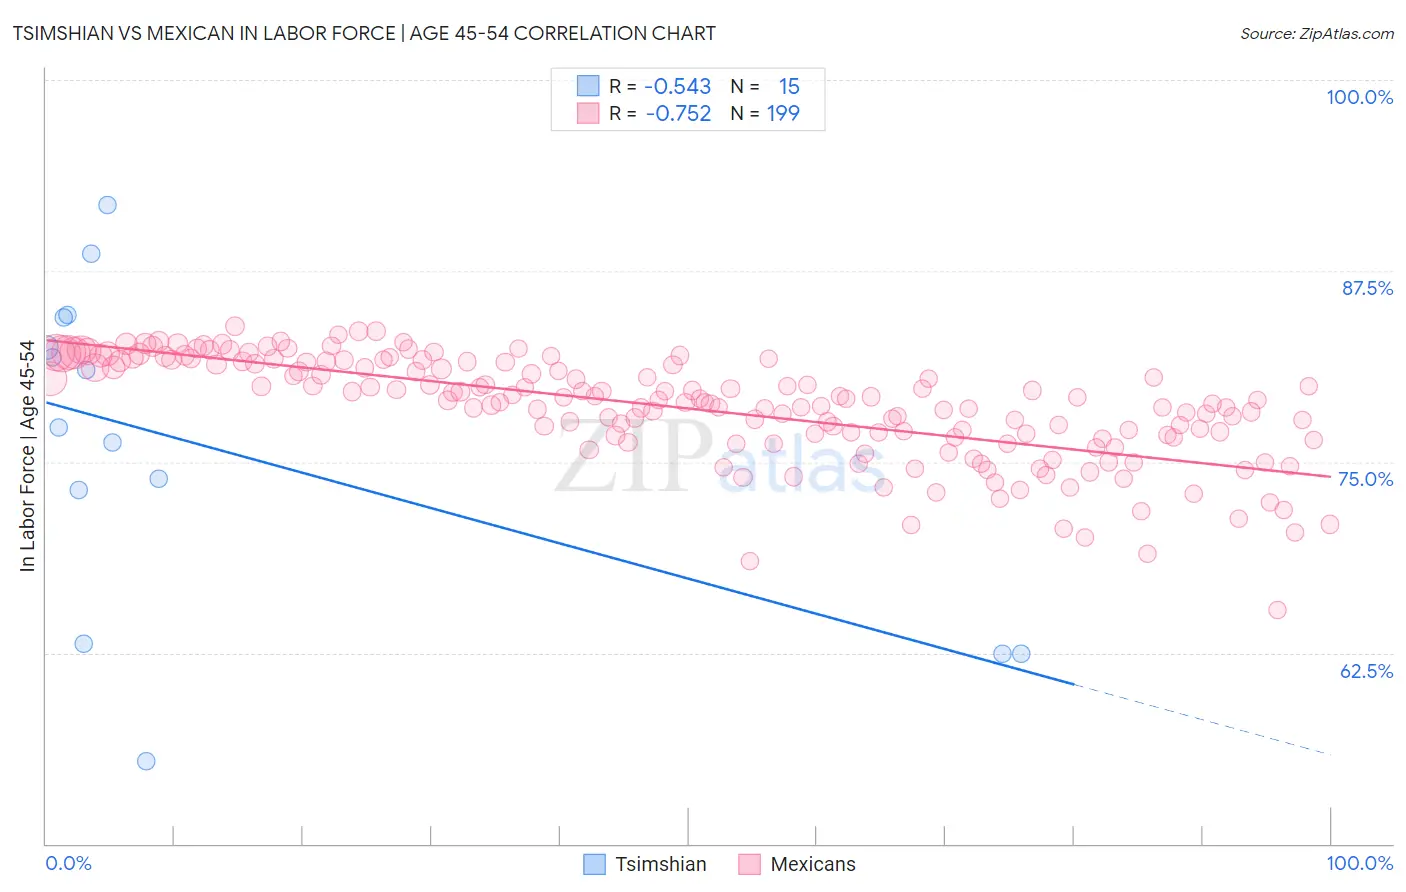
Tsimshian vs Mexican In Labor Force | Age 45-54 Correlation Chart
The statistical analysis conducted on geographies consisting of 15,626,261 people shows a substantial negative correlation between the proportion of Tsimshian and labor force participation rate among population between the ages 45 and 54 in the United States with a correlation coefficient (R) of -0.543 and weighted average of 77.4%. Similarly, the statistical analysis conducted on geographies consisting of 564,480,863 people shows a strong negative correlation between the proportion of Mexicans and labor force participation rate among population between the ages 45 and 54 in the United States with a correlation coefficient (R) of -0.752 and weighted average of 79.8%, a difference of 3.0%.
In Labor Force | Age 45-54 Correlation Summary
| Measurement | Tsimshian | Mexican |
| Minimum | 55.4% | 65.3% |
| Maximum | 91.8% | 83.9% |
| Range | 36.4% | 18.6% |
| Mean | 75.9% | 78.5% |
| Median | 77.2% | 79.0% |
| Interquartile 25% (IQ1) | 63.1% | 76.6% |
| Interquartile 75% (IQ3) | 84.5% | 81.5% |
| Interquartile Range (IQR) | 21.4% | 4.9% |
| Standard Deviation (Sample) | 10.8% | 3.4% |
| Standard Deviation (Population) | 10.4% | 3.4% |
Demographics Similar to Tsimshian and Mexicans by In Labor Force | Age 45-54
In terms of in labor force | age 45-54, the demographic groups most similar to Tsimshian are Cheyenne (77.6%, a difference of 0.15%), Creek (77.7%, a difference of 0.37%), Sioux (78.0%, a difference of 0.67%), Cajun (78.1%, a difference of 0.89%), and Seminole (78.1%, a difference of 0.90%). Similarly, the demographic groups most similar to Mexicans are Immigrants from Mexico (79.7%, a difference of 0.14%), Colville (79.5%, a difference of 0.39%), Ottawa (79.5%, a difference of 0.43%), Black/African American (79.3%, a difference of 0.56%), and Shoshone (79.3%, a difference of 0.65%).
| Demographics | Rating | Rank | In Labor Force | Age 45-54 |
| Mexicans | 0.0 /100 | #311 | Tragic 79.8% |
| Immigrants | Mexico | 0.0 /100 | #312 | Tragic 79.7% |
| Colville | 0.0 /100 | #313 | Tragic 79.5% |
| Ottawa | 0.0 /100 | #314 | Tragic 79.5% |
| Blacks/African Americans | 0.0 /100 | #315 | Tragic 79.3% |
| Shoshone | 0.0 /100 | #316 | Tragic 79.3% |
| Comanche | 0.0 /100 | #317 | Tragic 79.2% |
| Chickasaw | 0.0 /100 | #318 | Tragic 79.0% |
| Cherokee | 0.0 /100 | #319 | Tragic 79.0% |
| Yaqui | 0.0 /100 | #320 | Tragic 78.9% |
| Yup'ik | 0.0 /100 | #321 | Tragic 78.6% |
| Crow | 0.0 /100 | #322 | Tragic 78.3% |
| Kiowa | 0.0 /100 | #323 | Tragic 78.3% |
| Dutch West Indians | 0.0 /100 | #324 | Tragic 78.2% |
| Choctaw | 0.0 /100 | #325 | Tragic 78.2% |
| Seminole | 0.0 /100 | #326 | Tragic 78.1% |
| Cajuns | 0.0 /100 | #327 | Tragic 78.1% |
| Sioux | 0.0 /100 | #328 | Tragic 78.0% |
| Creek | 0.0 /100 | #329 | Tragic 77.7% |
| Cheyenne | 0.0 /100 | #330 | Tragic 77.6% |
| Tsimshian | 0.0 /100 | #331 | Tragic 77.4% |