Immigrants from Netherlands vs Mexican Receiving Food Stamps
COMPARE
Immigrants from Netherlands
Mexican
Receiving Food Stamps
Receiving Food Stamps Comparison
Immigrants from Netherlands
Mexicans
9.5%
RECEIVING FOOD STAMPS
99.5/ 100
METRIC RATING
40th/ 347
METRIC RANK
14.6%
RECEIVING FOOD STAMPS
0.1/ 100
METRIC RATING
270th/ 347
METRIC RANK
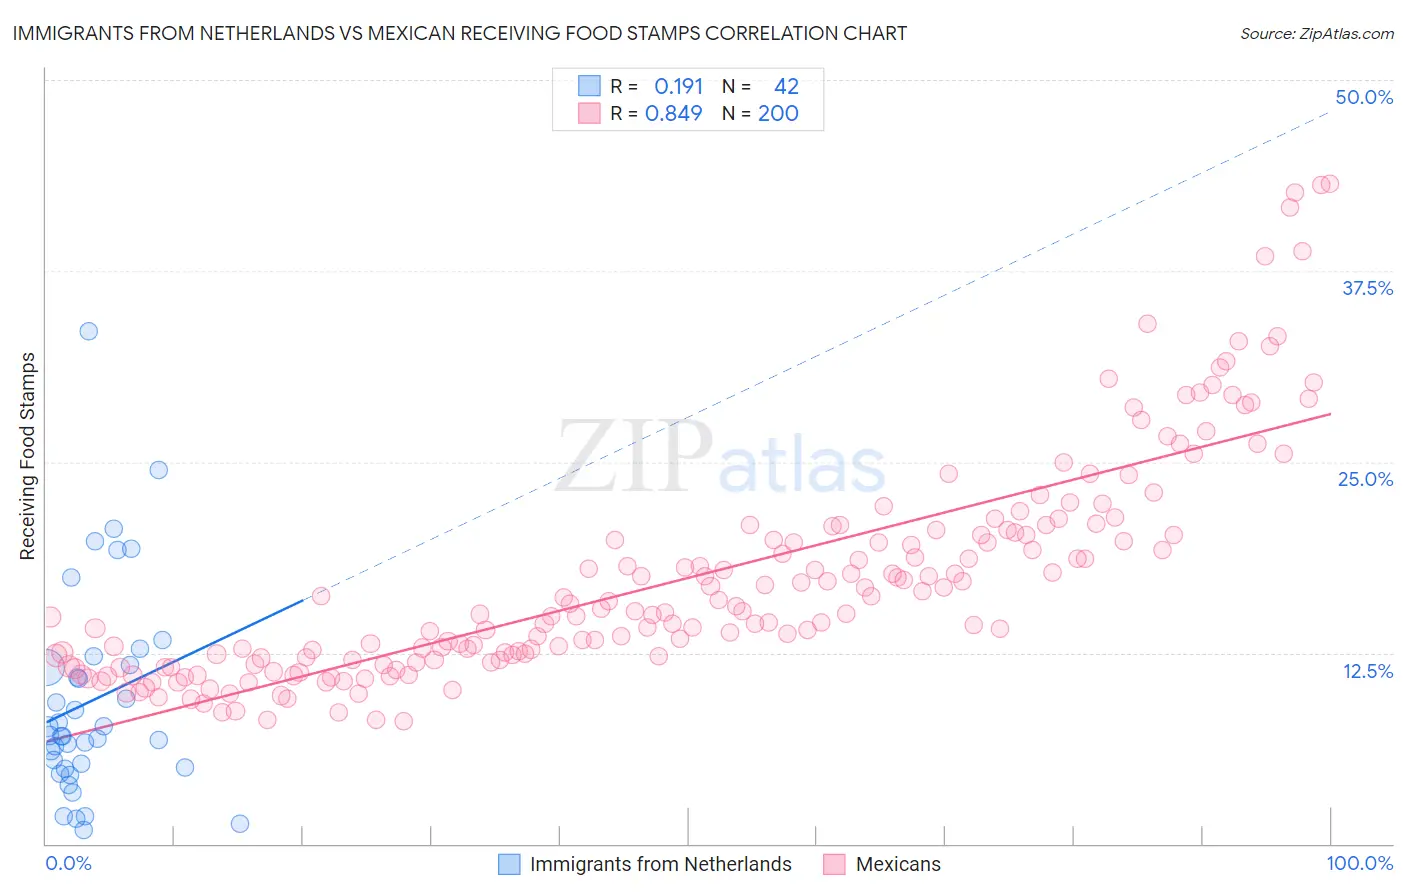
Immigrants from Netherlands vs Mexican Receiving Food Stamps Correlation Chart
The statistical analysis conducted on geographies consisting of 237,448,822 people shows a poor positive correlation between the proportion of Immigrants from Netherlands and percentage of population receiving government assistance and/or food stamps in the United States with a correlation coefficient (R) of 0.191 and weighted average of 9.5%. Similarly, the statistical analysis conducted on geographies consisting of 562,221,656 people shows a very strong positive correlation between the proportion of Mexicans and percentage of population receiving government assistance and/or food stamps in the United States with a correlation coefficient (R) of 0.849 and weighted average of 14.6%, a difference of 53.7%.
Receiving Food Stamps Correlation Summary
| Measurement | Immigrants from Netherlands | Mexican |
| Minimum | 0.90% | 8.0% |
| Maximum | 33.6% | 43.2% |
| Range | 32.7% | 35.2% |
| Mean | 9.4% | 17.4% |
| Median | 7.1% | 15.2% |
| Interquartile 25% (IQ1) | 5.0% | 12.1% |
| Interquartile 75% (IQ3) | 11.7% | 20.3% |
| Interquartile Range (IQR) | 6.7% | 8.2% |
| Standard Deviation (Sample) | 6.9% | 7.3% |
| Standard Deviation (Population) | 6.8% | 7.3% |
Similar Demographics by Receiving Food Stamps
Demographics Similar to Immigrants from Netherlands by Receiving Food Stamps
In terms of receiving food stamps, the demographic groups most similar to Immigrants from Netherlands are Immigrants from Bolivia (9.5%, a difference of 0.010%), Immigrants from Sri Lanka (9.5%, a difference of 0.020%), Cambodian (9.5%, a difference of 0.17%), European (9.5%, a difference of 0.31%), and Estonian (9.5%, a difference of 0.37%).
| Demographics | Rating | Rank | Receiving Food Stamps |
| Zimbabweans | 99.6 /100 | #33 | Exceptional 9.5% |
| Turks | 99.6 /100 | #34 | Exceptional 9.5% |
| Immigrants | Austria | 99.6 /100 | #35 | Exceptional 9.5% |
| Estonians | 99.6 /100 | #36 | Exceptional 9.5% |
| Europeans | 99.6 /100 | #37 | Exceptional 9.5% |
| Immigrants | Sri Lanka | 99.5 /100 | #38 | Exceptional 9.5% |
| Immigrants | Bolivia | 99.5 /100 | #39 | Exceptional 9.5% |
| Immigrants | Netherlands | 99.5 /100 | #40 | Exceptional 9.5% |
| Cambodians | 99.5 /100 | #41 | Exceptional 9.5% |
| Immigrants | China | 99.5 /100 | #42 | Exceptional 9.6% |
| Croatians | 99.5 /100 | #43 | Exceptional 9.6% |
| Immigrants | Denmark | 99.4 /100 | #44 | Exceptional 9.6% |
| Immigrants | Belgium | 99.4 /100 | #45 | Exceptional 9.6% |
| Australians | 99.4 /100 | #46 | Exceptional 9.6% |
| Indians (Asian) | 99.4 /100 | #47 | Exceptional 9.6% |
Demographics Similar to Mexicans by Receiving Food Stamps
In terms of receiving food stamps, the demographic groups most similar to Mexicans are Immigrants from Guatemala (14.6%, a difference of 0.090%), Nepalese (14.6%, a difference of 0.20%), Chippewa (14.7%, a difference of 0.32%), Alaskan Athabascan (14.7%, a difference of 0.35%), and Immigrants from Western Africa (14.7%, a difference of 0.36%).
| Demographics | Rating | Rank | Receiving Food Stamps |
| Immigrants | Portugal | 0.2 /100 | #263 | Tragic 14.3% |
| Immigrants | Uzbekistan | 0.2 /100 | #264 | Tragic 14.3% |
| Blackfeet | 0.2 /100 | #265 | Tragic 14.3% |
| Cheyenne | 0.2 /100 | #266 | Tragic 14.3% |
| Dutch West Indians | 0.2 /100 | #267 | Tragic 14.3% |
| Guatemalans | 0.1 /100 | #268 | Tragic 14.4% |
| Nepalese | 0.1 /100 | #269 | Tragic 14.6% |
| Mexicans | 0.1 /100 | #270 | Tragic 14.6% |
| Immigrants | Guatemala | 0.1 /100 | #271 | Tragic 14.6% |
| Chippewa | 0.1 /100 | #272 | Tragic 14.7% |
| Alaskan Athabascans | 0.1 /100 | #273 | Tragic 14.7% |
| Immigrants | Western Africa | 0.1 /100 | #274 | Tragic 14.7% |
| Ute | 0.1 /100 | #275 | Tragic 14.7% |
| Liberians | 0.1 /100 | #276 | Tragic 14.8% |
| Seminole | 0.1 /100 | #277 | Tragic 14.8% |