Immigrants from Morocco vs Delaware In Labor Force | Age 30-34
COMPARE
Immigrants from Morocco
Delaware
In Labor Force | Age 30-34
In Labor Force | Age 30-34 Comparison
Immigrants from Morocco
Delaware
85.6%
IN LABOR FORCE | AGE 30-34
99.8/ 100
METRIC RATING
46th/ 347
METRIC RANK
83.5%
IN LABOR FORCE | AGE 30-34
0.0/ 100
METRIC RATING
277th/ 347
METRIC RANK
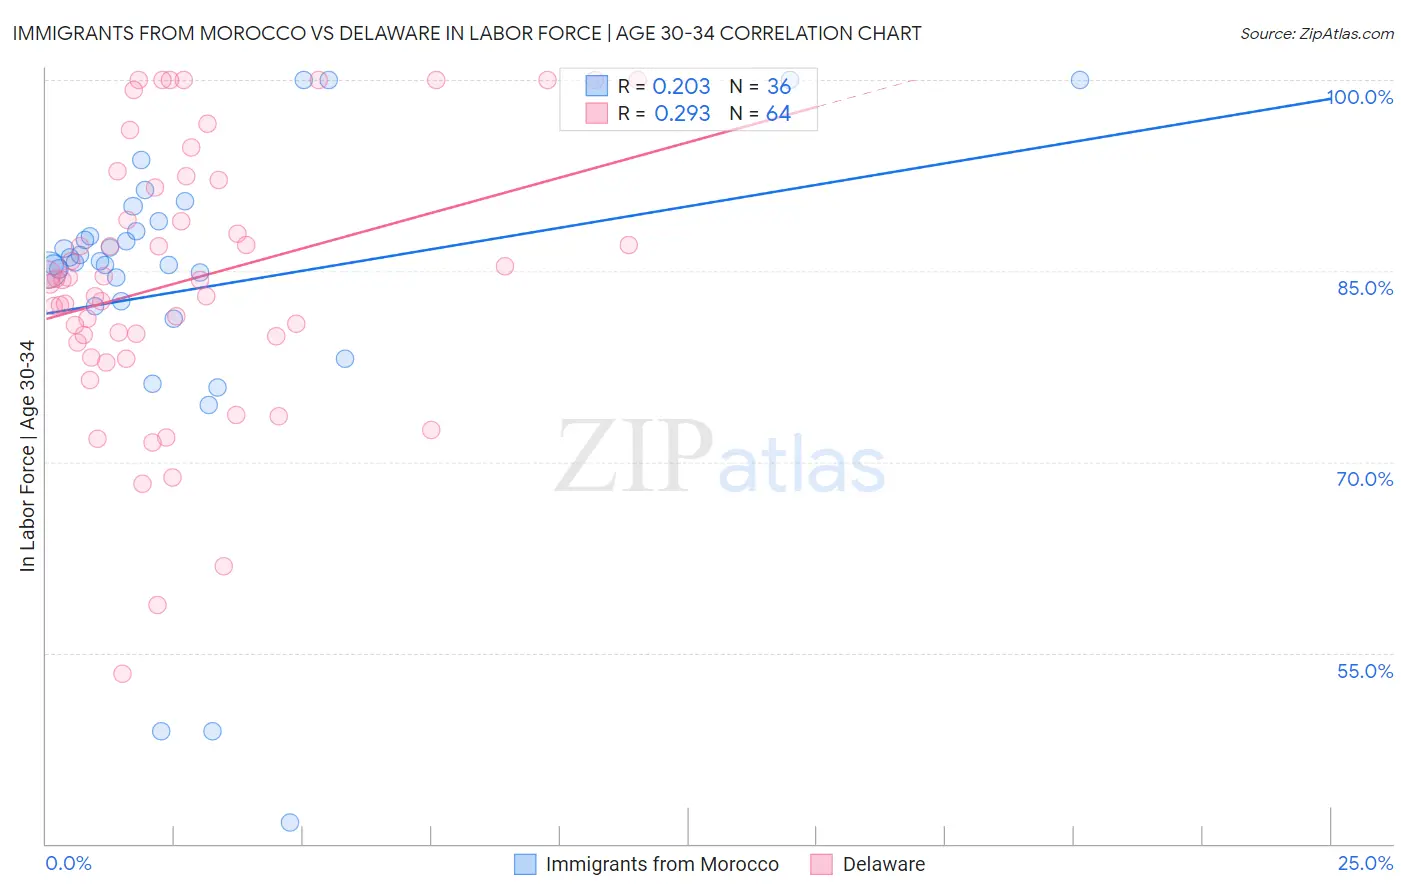
Immigrants from Morocco vs Delaware In Labor Force | Age 30-34 Correlation Chart
The statistical analysis conducted on geographies consisting of 178,904,869 people shows a weak positive correlation between the proportion of Immigrants from Morocco and labor force participation rate among population between the ages 30 and 34 in the United States with a correlation coefficient (R) of 0.203 and weighted average of 85.6%. Similarly, the statistical analysis conducted on geographies consisting of 96,207,196 people shows a weak positive correlation between the proportion of Delaware and labor force participation rate among population between the ages 30 and 34 in the United States with a correlation coefficient (R) of 0.293 and weighted average of 83.5%, a difference of 2.6%.
In Labor Force | Age 30-34 Correlation Summary
| Measurement | Immigrants from Morocco | Delaware |
| Minimum | 41.7% | 53.3% |
| Maximum | 100.0% | 100.0% |
| Range | 58.3% | 46.7% |
| Mean | 83.6% | 84.3% |
| Median | 85.7% | 84.3% |
| Interquartile 25% (IQ1) | 82.4% | 79.6% |
| Interquartile 75% (IQ3) | 88.5% | 91.8% |
| Interquartile Range (IQR) | 6.1% | 12.3% |
| Standard Deviation (Sample) | 13.0% | 10.5% |
| Standard Deviation (Population) | 12.8% | 10.4% |
Similar Demographics by In Labor Force | Age 30-34
Demographics Similar to Immigrants from Morocco by In Labor Force | Age 30-34
In terms of in labor force | age 30-34, the demographic groups most similar to Immigrants from Morocco are Croatian (85.6%, a difference of 0.0%), Immigrants from Sri Lanka (85.6%, a difference of 0.010%), Immigrants from Nepal (85.6%, a difference of 0.010%), Immigrants from Sweden (85.6%, a difference of 0.020%), and Lithuanian (85.6%, a difference of 0.020%).
| Demographics | Rating | Rank | In Labor Force | Age 30-34 |
| Eastern Europeans | 99.9 /100 | #39 | Exceptional 85.7% |
| Turks | 99.9 /100 | #40 | Exceptional 85.7% |
| Immigrants | Italy | 99.9 /100 | #41 | Exceptional 85.7% |
| Zimbabweans | 99.8 /100 | #42 | Exceptional 85.6% |
| Immigrants | Lithuania | 99.8 /100 | #43 | Exceptional 85.6% |
| Immigrants | Sri Lanka | 99.8 /100 | #44 | Exceptional 85.6% |
| Immigrants | Nepal | 99.8 /100 | #45 | Exceptional 85.6% |
| Immigrants | Morocco | 99.8 /100 | #46 | Exceptional 85.6% |
| Croatians | 99.8 /100 | #47 | Exceptional 85.6% |
| Immigrants | Sweden | 99.8 /100 | #48 | Exceptional 85.6% |
| Lithuanians | 99.8 /100 | #49 | Exceptional 85.6% |
| Immigrants | Australia | 99.8 /100 | #50 | Exceptional 85.6% |
| Cape Verdeans | 99.7 /100 | #51 | Exceptional 85.6% |
| Slovenes | 99.7 /100 | #52 | Exceptional 85.6% |
| Filipinos | 99.6 /100 | #53 | Exceptional 85.5% |
Demographics Similar to Delaware by In Labor Force | Age 30-34
In terms of in labor force | age 30-34, the demographic groups most similar to Delaware are Tongan (83.5%, a difference of 0.020%), Belizean (83.5%, a difference of 0.030%), Immigrants from Grenada (83.5%, a difference of 0.030%), Guamanian/Chamorro (83.5%, a difference of 0.040%), and Fijian (83.4%, a difference of 0.050%).
| Demographics | Rating | Rank | In Labor Force | Age 30-34 |
| Spanish Americans | 0.0 /100 | #270 | Tragic 83.5% |
| Spanish | 0.0 /100 | #271 | Tragic 83.5% |
| Immigrants | Nonimmigrants | 0.0 /100 | #272 | Tragic 83.5% |
| Guamanians/Chamorros | 0.0 /100 | #273 | Tragic 83.5% |
| Belizeans | 0.0 /100 | #274 | Tragic 83.5% |
| Immigrants | Grenada | 0.0 /100 | #275 | Tragic 83.5% |
| Tongans | 0.0 /100 | #276 | Tragic 83.5% |
| Delaware | 0.0 /100 | #277 | Tragic 83.5% |
| Fijians | 0.0 /100 | #278 | Tragic 83.4% |
| Immigrants | Fiji | 0.0 /100 | #279 | Tragic 83.4% |
| Africans | 0.0 /100 | #280 | Tragic 83.4% |
| Samoans | 0.0 /100 | #281 | Tragic 83.3% |
| Mexican American Indians | 0.0 /100 | #282 | Tragic 83.2% |
| Assyrians/Chaldeans/Syriacs | 0.0 /100 | #283 | Tragic 83.2% |
| Immigrants | Belize | 0.0 /100 | #284 | Tragic 83.2% |