Immigrants from Morocco vs Laotian In Labor Force | Age 30-34
COMPARE
Immigrants from Morocco
Laotian
In Labor Force | Age 30-34
In Labor Force | Age 30-34 Comparison
Immigrants from Morocco
Laotians
85.6%
IN LABOR FORCE | AGE 30-34
99.8/ 100
METRIC RATING
46th/ 347
METRIC RANK
84.7%
IN LABOR FORCE | AGE 30-34
46.9/ 100
METRIC RATING
177th/ 347
METRIC RANK
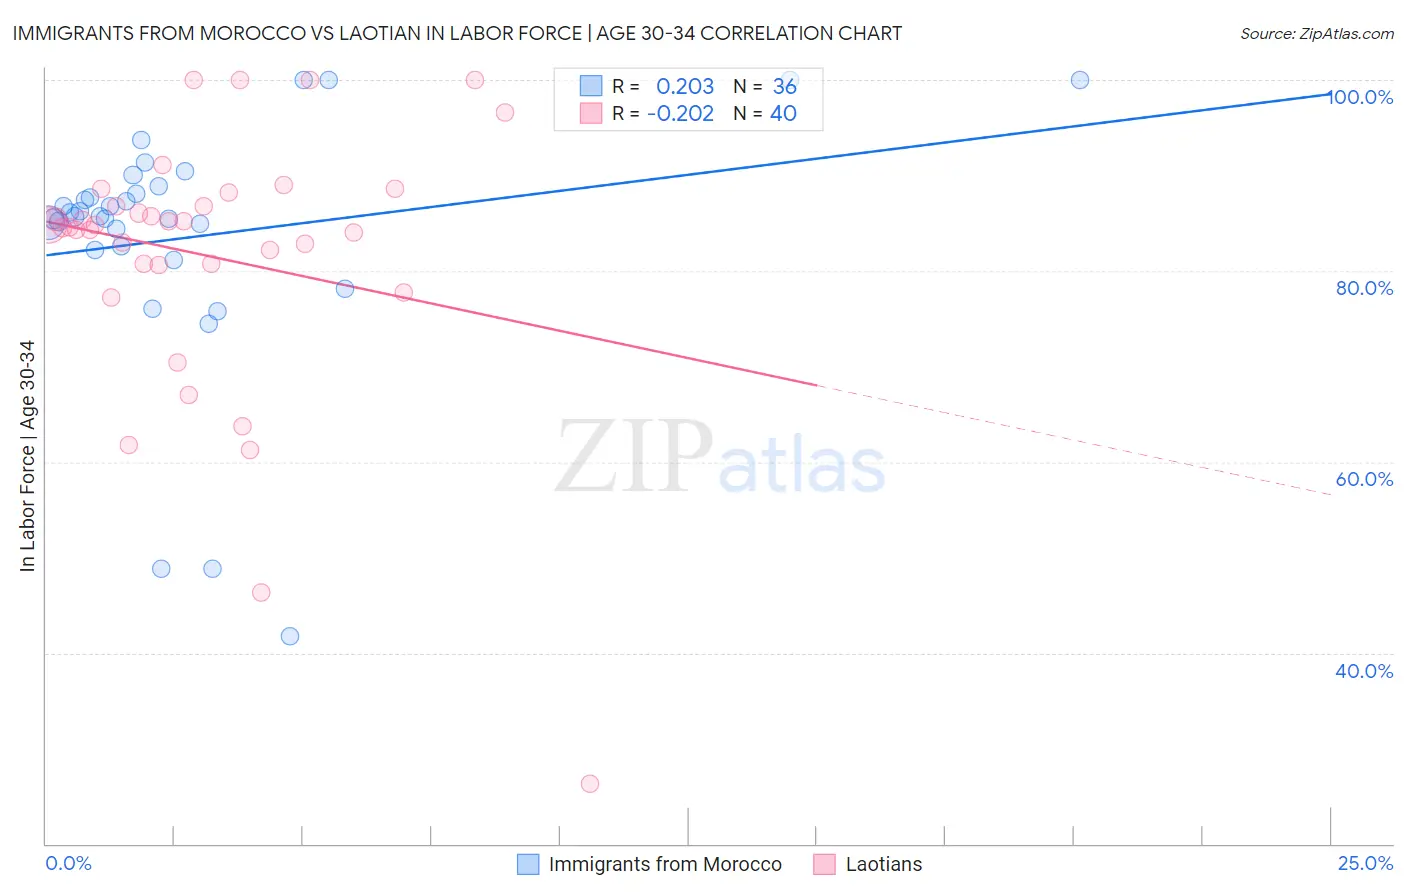
Immigrants from Morocco vs Laotian In Labor Force | Age 30-34 Correlation Chart
The statistical analysis conducted on geographies consisting of 178,904,869 people shows a weak positive correlation between the proportion of Immigrants from Morocco and labor force participation rate among population between the ages 30 and 34 in the United States with a correlation coefficient (R) of 0.203 and weighted average of 85.6%. Similarly, the statistical analysis conducted on geographies consisting of 224,759,127 people shows a weak negative correlation between the proportion of Laotians and labor force participation rate among population between the ages 30 and 34 in the United States with a correlation coefficient (R) of -0.202 and weighted average of 84.7%, a difference of 1.1%.
In Labor Force | Age 30-34 Correlation Summary
| Measurement | Immigrants from Morocco | Laotian |
| Minimum | 41.7% | 26.3% |
| Maximum | 100.0% | 100.0% |
| Range | 58.3% | 73.7% |
| Mean | 83.6% | 81.6% |
| Median | 85.7% | 84.7% |
| Interquartile 25% (IQ1) | 82.4% | 80.7% |
| Interquartile 75% (IQ3) | 88.5% | 87.5% |
| Interquartile Range (IQR) | 6.1% | 6.8% |
| Standard Deviation (Sample) | 13.0% | 14.2% |
| Standard Deviation (Population) | 12.8% | 14.0% |
Similar Demographics by In Labor Force | Age 30-34
Demographics Similar to Immigrants from Morocco by In Labor Force | Age 30-34
In terms of in labor force | age 30-34, the demographic groups most similar to Immigrants from Morocco are Croatian (85.6%, a difference of 0.0%), Immigrants from Sri Lanka (85.6%, a difference of 0.010%), Immigrants from Nepal (85.6%, a difference of 0.010%), Immigrants from Sweden (85.6%, a difference of 0.020%), and Lithuanian (85.6%, a difference of 0.020%).
| Demographics | Rating | Rank | In Labor Force | Age 30-34 |
| Eastern Europeans | 99.9 /100 | #39 | Exceptional 85.7% |
| Turks | 99.9 /100 | #40 | Exceptional 85.7% |
| Immigrants | Italy | 99.9 /100 | #41 | Exceptional 85.7% |
| Zimbabweans | 99.8 /100 | #42 | Exceptional 85.6% |
| Immigrants | Lithuania | 99.8 /100 | #43 | Exceptional 85.6% |
| Immigrants | Sri Lanka | 99.8 /100 | #44 | Exceptional 85.6% |
| Immigrants | Nepal | 99.8 /100 | #45 | Exceptional 85.6% |
| Immigrants | Morocco | 99.8 /100 | #46 | Exceptional 85.6% |
| Croatians | 99.8 /100 | #47 | Exceptional 85.6% |
| Immigrants | Sweden | 99.8 /100 | #48 | Exceptional 85.6% |
| Lithuanians | 99.8 /100 | #49 | Exceptional 85.6% |
| Immigrants | Australia | 99.8 /100 | #50 | Exceptional 85.6% |
| Cape Verdeans | 99.7 /100 | #51 | Exceptional 85.6% |
| Slovenes | 99.7 /100 | #52 | Exceptional 85.6% |
| Filipinos | 99.6 /100 | #53 | Exceptional 85.5% |
Demographics Similar to Laotians by In Labor Force | Age 30-34
In terms of in labor force | age 30-34, the demographic groups most similar to Laotians are Finnish (84.7%, a difference of 0.020%), Immigrants from South America (84.7%, a difference of 0.020%), Immigrants from Uzbekistan (84.7%, a difference of 0.020%), Okinawan (84.6%, a difference of 0.020%), and Immigrants from England (84.7%, a difference of 0.030%).
| Demographics | Rating | Rank | In Labor Force | Age 30-34 |
| Immigrants | Burma/Myanmar | 52.0 /100 | #170 | Average 84.7% |
| Irish | 52.0 /100 | #171 | Average 84.7% |
| Immigrants | England | 51.7 /100 | #172 | Average 84.7% |
| Israelis | 51.1 /100 | #173 | Average 84.7% |
| Finns | 50.0 /100 | #174 | Average 84.7% |
| Immigrants | South America | 50.0 /100 | #175 | Average 84.7% |
| Immigrants | Uzbekistan | 49.1 /100 | #176 | Average 84.7% |
| Laotians | 46.9 /100 | #177 | Average 84.7% |
| Okinawans | 44.1 /100 | #178 | Average 84.6% |
| Immigrants | Nigeria | 42.5 /100 | #179 | Average 84.6% |
| Immigrants | Netherlands | 42.1 /100 | #180 | Average 84.6% |
| Moroccans | 40.3 /100 | #181 | Average 84.6% |
| Barbadians | 36.7 /100 | #182 | Fair 84.6% |
| Immigrants | Canada | 35.0 /100 | #183 | Fair 84.6% |
| Immigrants | North America | 33.3 /100 | #184 | Fair 84.6% |