Immigrants from Morocco vs Paiute In Labor Force | Age 20-24
COMPARE
Immigrants from Morocco
Paiute
In Labor Force | Age 20-24
In Labor Force | Age 20-24 Comparison
Immigrants from Morocco
Paiute
75.9%
IN LABOR FORCE | AGE 20-24
95.8/ 100
METRIC RATING
110th/ 347
METRIC RANK
75.3%
IN LABOR FORCE | AGE 20-24
74.1/ 100
METRIC RATING
151st/ 347
METRIC RANK
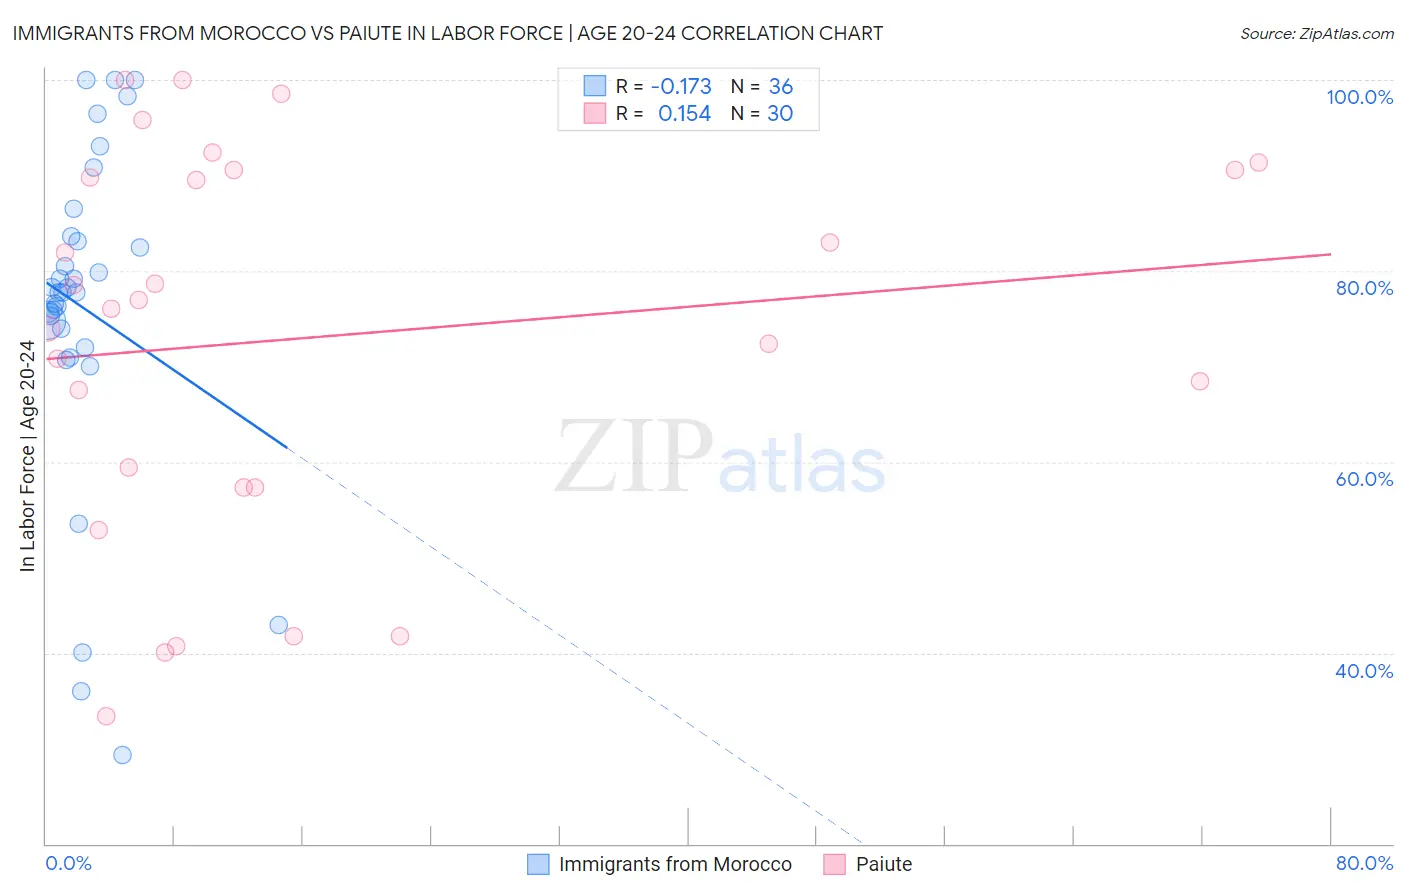
Immigrants from Morocco vs Paiute In Labor Force | Age 20-24 Correlation Chart
The statistical analysis conducted on geographies consisting of 178,862,566 people shows a poor negative correlation between the proportion of Immigrants from Morocco and labor force participation rate among population between the ages 20 and 24 in the United States with a correlation coefficient (R) of -0.173 and weighted average of 75.9%. Similarly, the statistical analysis conducted on geographies consisting of 58,387,472 people shows a poor positive correlation between the proportion of Paiute and labor force participation rate among population between the ages 20 and 24 in the United States with a correlation coefficient (R) of 0.154 and weighted average of 75.3%, a difference of 0.76%.
In Labor Force | Age 20-24 Correlation Summary
| Measurement | Immigrants from Morocco | Paiute |
| Minimum | 29.3% | 33.3% |
| Maximum | 100.0% | 100.0% |
| Range | 70.7% | 66.7% |
| Mean | 76.0% | 73.0% |
| Median | 77.8% | 76.5% |
| Interquartile 25% (IQ1) | 72.9% | 57.3% |
| Interquartile 75% (IQ3) | 83.4% | 90.6% |
| Interquartile Range (IQR) | 10.5% | 33.3% |
| Standard Deviation (Sample) | 17.1% | 20.0% |
| Standard Deviation (Population) | 16.9% | 19.7% |
Similar Demographics by In Labor Force | Age 20-24
Demographics Similar to Immigrants from Morocco by In Labor Force | Age 20-24
In terms of in labor force | age 20-24, the demographic groups most similar to Immigrants from Morocco are Cherokee (75.9%, a difference of 0.0%), Ukrainian (75.9%, a difference of 0.010%), Immigrants from Canada (75.9%, a difference of 0.020%), Immigrants from Netherlands (75.9%, a difference of 0.050%), and Immigrants from Zimbabwe (75.9%, a difference of 0.060%).
| Demographics | Rating | Rank | In Labor Force | Age 20-24 |
| Immigrants | North Macedonia | 97.5 /100 | #103 | Exceptional 76.1% |
| Macedonians | 97.2 /100 | #104 | Exceptional 76.0% |
| Immigrants | Nepal | 97.2 /100 | #105 | Exceptional 76.0% |
| Immigrants | Uganda | 97.1 /100 | #106 | Exceptional 76.0% |
| Greeks | 96.9 /100 | #107 | Exceptional 76.0% |
| Iraqis | 96.6 /100 | #108 | Exceptional 76.0% |
| Cherokee | 95.8 /100 | #109 | Exceptional 75.9% |
| Immigrants | Morocco | 95.8 /100 | #110 | Exceptional 75.9% |
| Ukrainians | 95.7 /100 | #111 | Exceptional 75.9% |
| Immigrants | Canada | 95.6 /100 | #112 | Exceptional 75.9% |
| Immigrants | Netherlands | 95.3 /100 | #113 | Exceptional 75.9% |
| Immigrants | Zimbabwe | 95.1 /100 | #114 | Exceptional 75.9% |
| Alaska Natives | 95.1 /100 | #115 | Exceptional 75.9% |
| Immigrants | North America | 95.0 /100 | #116 | Exceptional 75.9% |
| Assyrians/Chaldeans/Syriacs | 94.9 /100 | #117 | Exceptional 75.9% |
Demographics Similar to Paiute by In Labor Force | Age 20-24
In terms of in labor force | age 20-24, the demographic groups most similar to Paiute are Salvadoran (75.3%, a difference of 0.010%), Lebanese (75.3%, a difference of 0.010%), Guatemalan (75.3%, a difference of 0.030%), Osage (75.3%, a difference of 0.030%), and Ugandan (75.4%, a difference of 0.040%).
| Demographics | Rating | Rank | In Labor Force | Age 20-24 |
| Bhutanese | 80.8 /100 | #144 | Excellent 75.4% |
| Koreans | 79.7 /100 | #145 | Good 75.4% |
| Mexican American Indians | 78.8 /100 | #146 | Good 75.4% |
| Comanche | 77.6 /100 | #147 | Good 75.4% |
| Immigrants | Cambodia | 76.7 /100 | #148 | Good 75.4% |
| Ugandans | 76.1 /100 | #149 | Good 75.4% |
| Salvadorans | 74.8 /100 | #150 | Good 75.3% |
| Paiute | 74.1 /100 | #151 | Good 75.3% |
| Lebanese | 73.5 /100 | #152 | Good 75.3% |
| Guatemalans | 72.3 /100 | #153 | Good 75.3% |
| Osage | 72.3 /100 | #154 | Good 75.3% |
| Immigrants | Guatemala | 71.9 /100 | #155 | Good 75.3% |
| Immigrants | El Salvador | 71.7 /100 | #156 | Good 75.3% |
| Immigrants | Western Europe | 71.5 /100 | #157 | Good 75.3% |
| Immigrants | Bolivia | 71.0 /100 | #158 | Good 75.3% |