Immigrants from Morocco vs Hungarian In Labor Force | Age 20-24
COMPARE
Immigrants from Morocco
Hungarian
In Labor Force | Age 20-24
In Labor Force | Age 20-24 Comparison
Immigrants from Morocco
Hungarians
75.9%
IN LABOR FORCE | AGE 20-24
95.8/ 100
METRIC RATING
110th/ 347
METRIC RANK
76.3%
IN LABOR FORCE | AGE 20-24
98.9/ 100
METRIC RATING
93rd/ 347
METRIC RANK
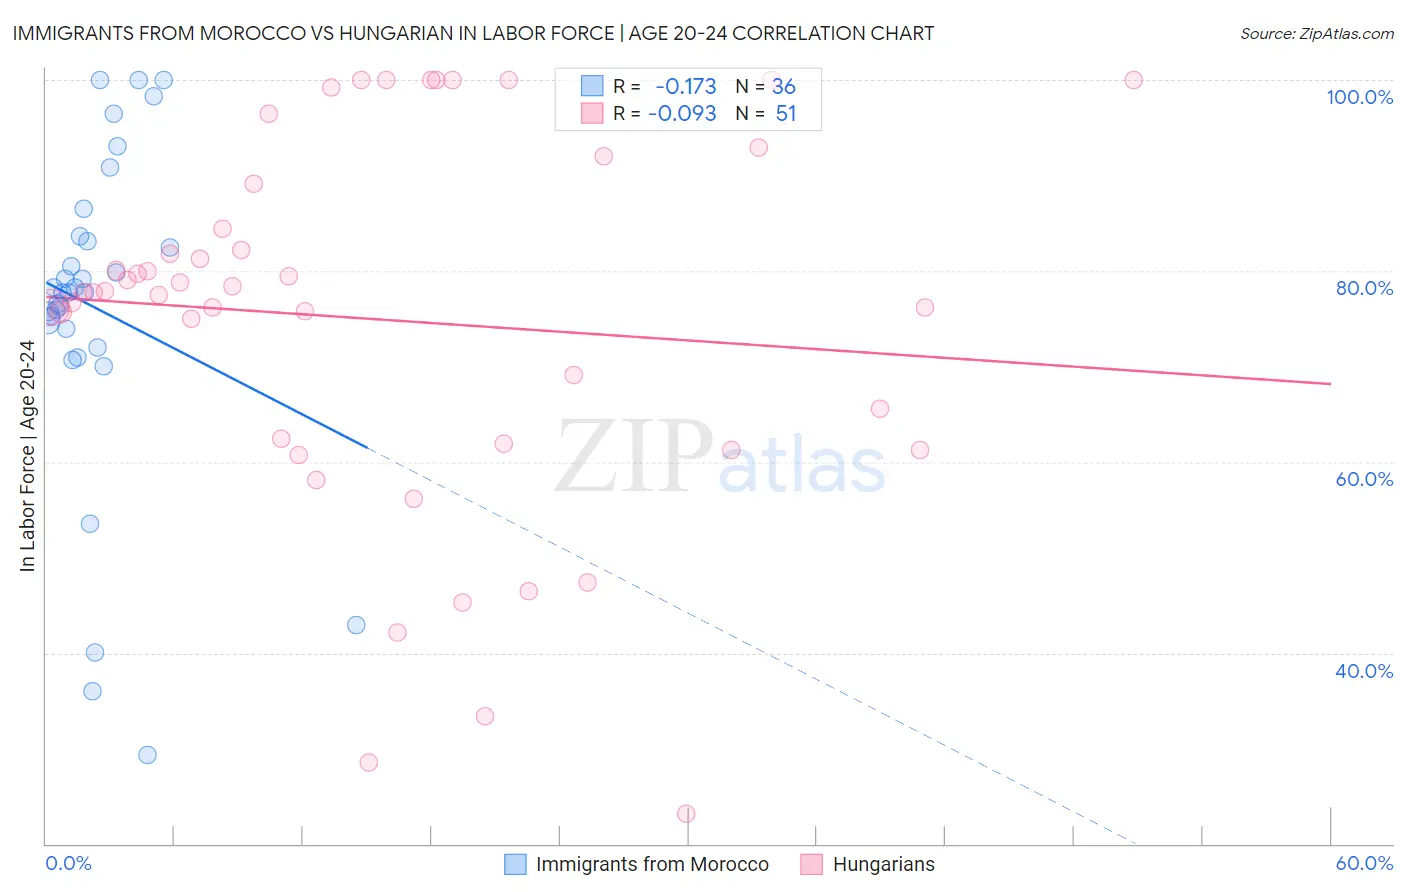
Immigrants from Morocco vs Hungarian In Labor Force | Age 20-24 Correlation Chart
The statistical analysis conducted on geographies consisting of 178,862,566 people shows a poor negative correlation between the proportion of Immigrants from Morocco and labor force participation rate among population between the ages 20 and 24 in the United States with a correlation coefficient (R) of -0.173 and weighted average of 75.9%. Similarly, the statistical analysis conducted on geographies consisting of 485,725,263 people shows a slight negative correlation between the proportion of Hungarians and labor force participation rate among population between the ages 20 and 24 in the United States with a correlation coefficient (R) of -0.093 and weighted average of 76.3%, a difference of 0.49%.
In Labor Force | Age 20-24 Correlation Summary
| Measurement | Immigrants from Morocco | Hungarian |
| Minimum | 29.3% | 23.1% |
| Maximum | 100.0% | 100.0% |
| Range | 70.7% | 76.9% |
| Mean | 76.0% | 74.9% |
| Median | 77.8% | 77.8% |
| Interquartile 25% (IQ1) | 72.9% | 61.9% |
| Interquartile 75% (IQ3) | 83.4% | 89.1% |
| Interquartile Range (IQR) | 10.5% | 27.2% |
| Standard Deviation (Sample) | 17.1% | 19.5% |
| Standard Deviation (Population) | 16.9% | 19.3% |
Demographics Similar to Immigrants from Morocco and Hungarians by In Labor Force | Age 20-24
In terms of in labor force | age 20-24, the demographic groups most similar to Immigrants from Morocco are Cherokee (75.9%, a difference of 0.0%), Ukrainian (75.9%, a difference of 0.010%), Iraqi (76.0%, a difference of 0.080%), Greek (76.0%, a difference of 0.11%), and Immigrants from Uganda (76.0%, a difference of 0.14%). Similarly, the demographic groups most similar to Hungarians are Maltese (76.3%, a difference of 0.020%), Sierra Leonean (76.3%, a difference of 0.050%), Potawatomi (76.2%, a difference of 0.090%), Immigrants from Germany (76.2%, a difference of 0.10%), and Nonimmigrants (76.2%, a difference of 0.11%).
| Demographics | Rating | Rank | In Labor Force | Age 20-24 |
| Sierra Leoneans | 99.0 /100 | #91 | Exceptional 76.3% |
| Maltese | 98.9 /100 | #92 | Exceptional 76.3% |
| Hungarians | 98.9 /100 | #93 | Exceptional 76.3% |
| Potawatomi | 98.5 /100 | #94 | Exceptional 76.2% |
| Immigrants | Germany | 98.5 /100 | #95 | Exceptional 76.2% |
| Immigrants | Nonimmigrants | 98.5 /100 | #96 | Exceptional 76.2% |
| Immigrants | Lithuania | 98.0 /100 | #97 | Exceptional 76.1% |
| Immigrants | Oceania | 98.0 /100 | #98 | Exceptional 76.1% |
| Americans | 97.8 /100 | #99 | Exceptional 76.1% |
| Shoshone | 97.8 /100 | #100 | Exceptional 76.1% |
| Immigrants | Poland | 97.7 /100 | #101 | Exceptional 76.1% |
| Latvians | 97.6 /100 | #102 | Exceptional 76.1% |
| Immigrants | North Macedonia | 97.5 /100 | #103 | Exceptional 76.1% |
| Macedonians | 97.2 /100 | #104 | Exceptional 76.0% |
| Immigrants | Nepal | 97.2 /100 | #105 | Exceptional 76.0% |
| Immigrants | Uganda | 97.1 /100 | #106 | Exceptional 76.0% |
| Greeks | 96.9 /100 | #107 | Exceptional 76.0% |
| Iraqis | 96.6 /100 | #108 | Exceptional 76.0% |
| Cherokee | 95.8 /100 | #109 | Exceptional 75.9% |
| Immigrants | Morocco | 95.8 /100 | #110 | Exceptional 75.9% |
| Ukrainians | 95.7 /100 | #111 | Exceptional 75.9% |