Palestinian vs Immigrants from Somalia In Labor Force | Age 20-24
COMPARE
Palestinian
Immigrants from Somalia
In Labor Force | Age 20-24
In Labor Force | Age 20-24 Comparison
Palestinians
Immigrants from Somalia
75.6%
IN LABOR FORCE | AGE 20-24
88.4/ 100
METRIC RATING
132nd/ 347
METRIC RANK
79.5%
IN LABOR FORCE | AGE 20-24
100.0/ 100
METRIC RATING
2nd/ 347
METRIC RANK
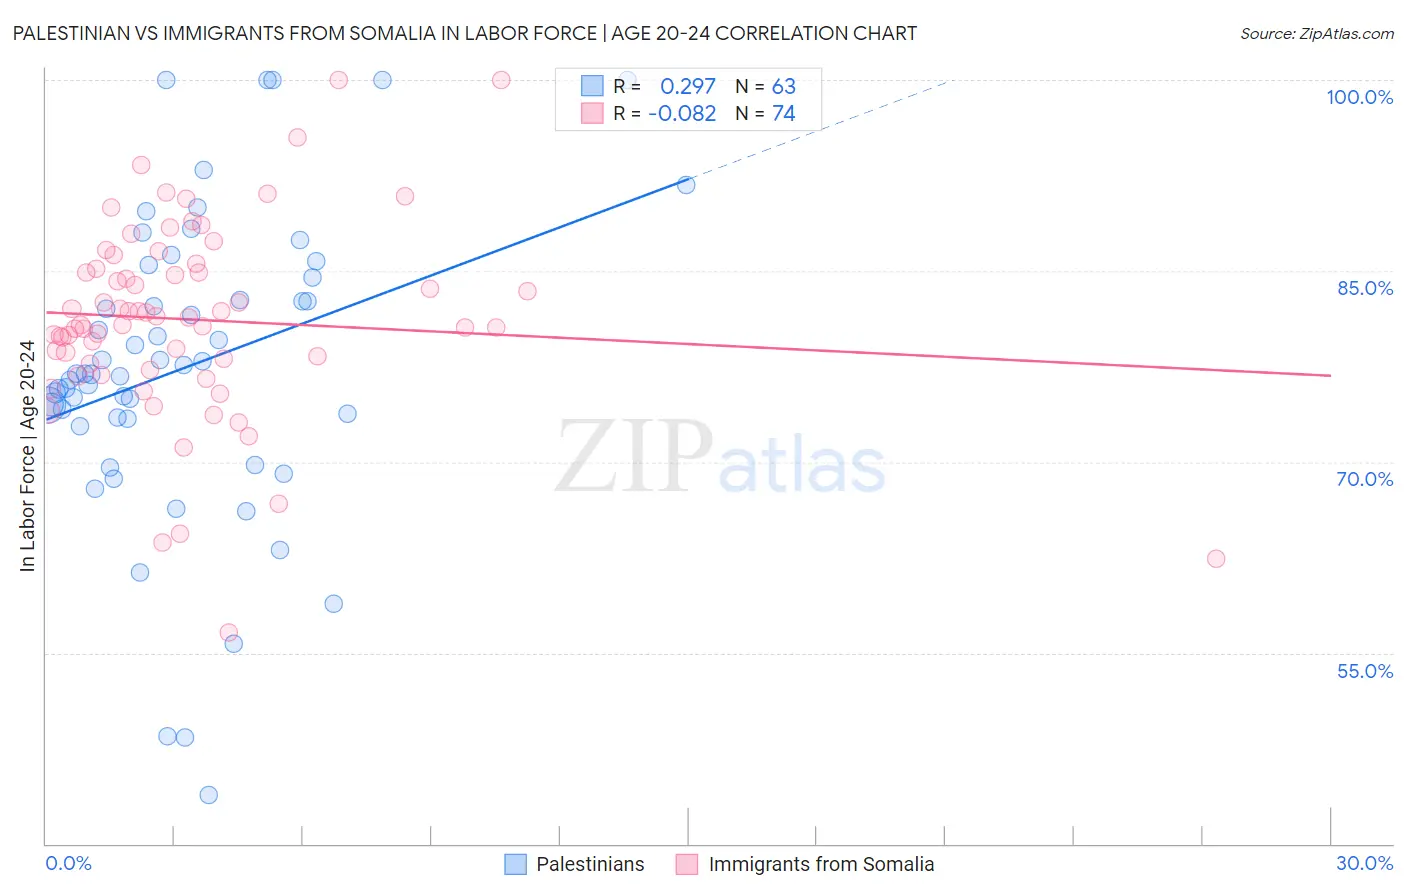
Palestinian vs Immigrants from Somalia In Labor Force | Age 20-24 Correlation Chart
The statistical analysis conducted on geographies consisting of 216,454,199 people shows a weak positive correlation between the proportion of Palestinians and labor force participation rate among population between the ages 20 and 24 in the United States with a correlation coefficient (R) of 0.297 and weighted average of 75.6%. Similarly, the statistical analysis conducted on geographies consisting of 92,105,737 people shows a slight negative correlation between the proportion of Immigrants from Somalia and labor force participation rate among population between the ages 20 and 24 in the United States with a correlation coefficient (R) of -0.082 and weighted average of 79.5%, a difference of 5.2%.
In Labor Force | Age 20-24 Correlation Summary
| Measurement | Palestinian | Immigrants from Somalia |
| Minimum | 43.8% | 56.6% |
| Maximum | 100.0% | 100.0% |
| Range | 56.2% | 43.4% |
| Mean | 77.5% | 81.2% |
| Median | 76.9% | 81.1% |
| Interquartile 25% (IQ1) | 73.4% | 77.7% |
| Interquartile 75% (IQ3) | 84.5% | 85.2% |
| Interquartile Range (IQR) | 11.1% | 7.5% |
| Standard Deviation (Sample) | 12.0% | 7.7% |
| Standard Deviation (Population) | 11.9% | 7.7% |
Similar Demographics by In Labor Force | Age 20-24
Demographics Similar to Palestinians by In Labor Force | Age 20-24
In terms of in labor force | age 20-24, the demographic groups most similar to Palestinians are Immigrants from Jordan (75.6%, a difference of 0.0%), Immigrants from Austria (75.6%, a difference of 0.010%), Zimbabwean (75.6%, a difference of 0.010%), Iroquois (75.6%, a difference of 0.020%), and Immigrants from Afghanistan (75.6%, a difference of 0.040%).
| Demographics | Rating | Rank | In Labor Force | Age 20-24 |
| Immigrants | Scotland | 93.7 /100 | #125 | Exceptional 75.8% |
| Brazilians | 93.0 /100 | #126 | Exceptional 75.8% |
| Sub-Saharan Africans | 90.9 /100 | #127 | Exceptional 75.7% |
| Immigrants | Afghanistan | 89.4 /100 | #128 | Excellent 75.6% |
| Iroquois | 89.1 /100 | #129 | Excellent 75.6% |
| Immigrants | Austria | 88.8 /100 | #130 | Excellent 75.6% |
| Immigrants | Jordan | 88.5 /100 | #131 | Excellent 75.6% |
| Palestinians | 88.4 /100 | #132 | Excellent 75.6% |
| Zimbabweans | 88.2 /100 | #133 | Excellent 75.6% |
| Estonians | 87.1 /100 | #134 | Excellent 75.6% |
| Yaqui | 85.5 /100 | #135 | Excellent 75.5% |
| Immigrants | Brazil | 84.8 /100 | #136 | Excellent 75.5% |
| Jordanians | 84.8 /100 | #137 | Excellent 75.5% |
| Australians | 84.8 /100 | #138 | Excellent 75.5% |
| Immigrants | England | 84.6 /100 | #139 | Excellent 75.5% |
Demographics Similar to Immigrants from Somalia by In Labor Force | Age 20-24
In terms of in labor force | age 20-24, the demographic groups most similar to Immigrants from Somalia are Somali (79.3%, a difference of 0.36%), Alaskan Athabascan (79.1%, a difference of 0.55%), Aleut (79.0%, a difference of 0.69%), Danish (79.0%, a difference of 0.70%), and Luxembourger (79.0%, a difference of 0.74%).
| Demographics | Rating | Rank | In Labor Force | Age 20-24 |
| Norwegians | 100.0 /100 | #1 | Exceptional 80.1% |
| Immigrants | Somalia | 100.0 /100 | #2 | Exceptional 79.5% |
| Somalis | 100.0 /100 | #3 | Exceptional 79.3% |
| Alaskan Athabascans | 100.0 /100 | #4 | Exceptional 79.1% |
| Aleuts | 100.0 /100 | #5 | Exceptional 79.0% |
| Danes | 100.0 /100 | #6 | Exceptional 79.0% |
| Luxembourgers | 100.0 /100 | #7 | Exceptional 79.0% |
| Immigrants | Cabo Verde | 100.0 /100 | #8 | Exceptional 78.9% |
| Swedes | 100.0 /100 | #9 | Exceptional 78.8% |
| Slovenes | 100.0 /100 | #10 | Exceptional 78.7% |
| Finns | 100.0 /100 | #11 | Exceptional 78.7% |
| Germans | 100.0 /100 | #12 | Exceptional 78.6% |
| Scandinavians | 100.0 /100 | #13 | Exceptional 78.5% |
| Czechs | 100.0 /100 | #14 | Exceptional 78.5% |
| Sudanese | 100.0 /100 | #15 | Exceptional 78.4% |