Scotch-Irish vs Immigrants from Somalia In Labor Force | Age 20-24
COMPARE
Scotch-Irish
Immigrants from Somalia
In Labor Force | Age 20-24
In Labor Force | Age 20-24 Comparison
Scotch-Irish
Immigrants from Somalia
77.0%
IN LABOR FORCE | AGE 20-24
99.9/ 100
METRIC RATING
59th/ 347
METRIC RANK
79.5%
IN LABOR FORCE | AGE 20-24
100.0/ 100
METRIC RATING
2nd/ 347
METRIC RANK
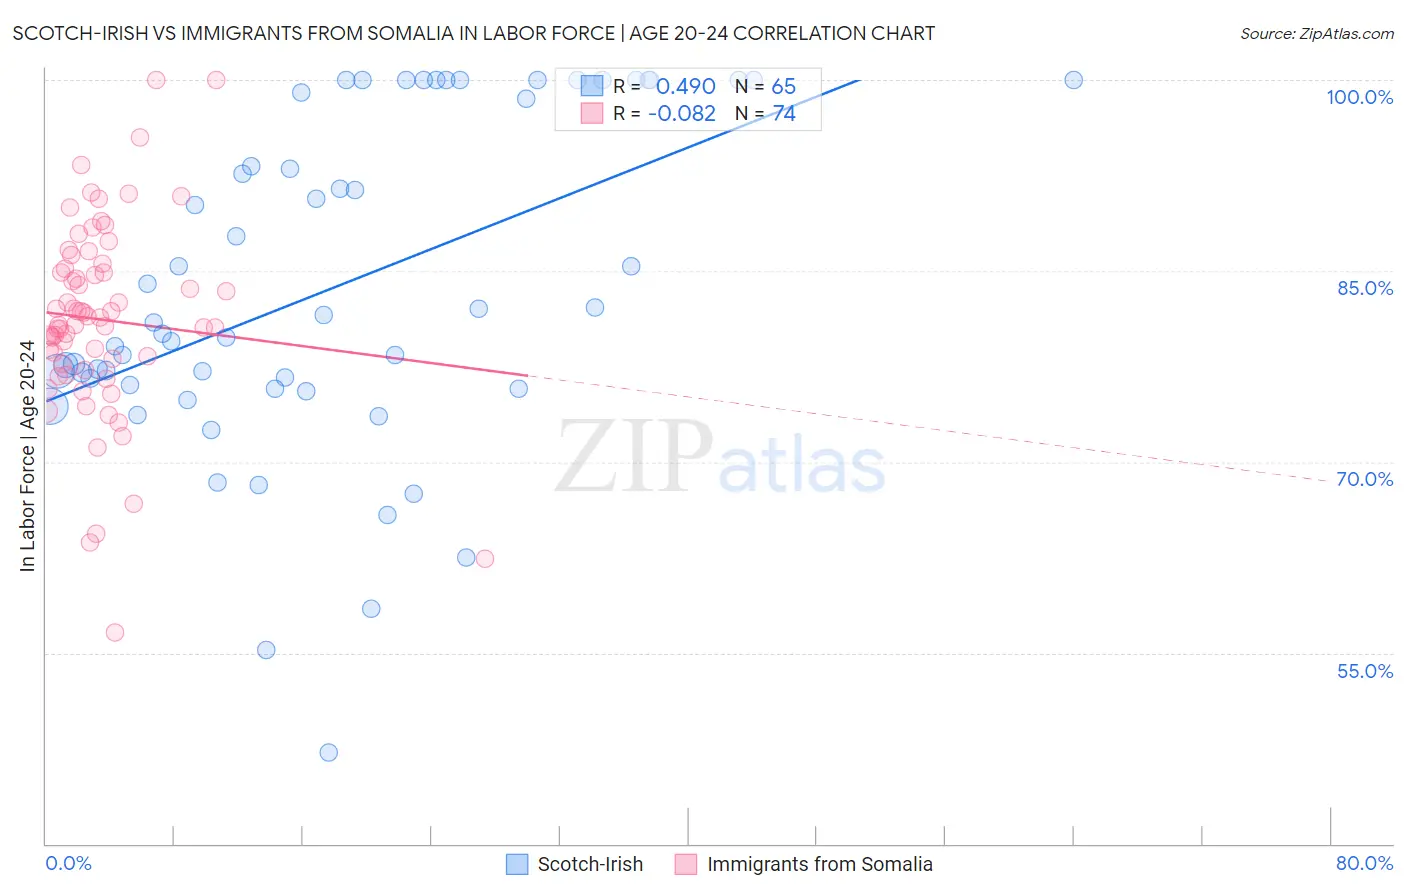
Scotch-Irish vs Immigrants from Somalia In Labor Force | Age 20-24 Correlation Chart
The statistical analysis conducted on geographies consisting of 547,632,235 people shows a moderate positive correlation between the proportion of Scotch-Irish and labor force participation rate among population between the ages 20 and 24 in the United States with a correlation coefficient (R) of 0.490 and weighted average of 77.0%. Similarly, the statistical analysis conducted on geographies consisting of 92,105,737 people shows a slight negative correlation between the proportion of Immigrants from Somalia and labor force participation rate among population between the ages 20 and 24 in the United States with a correlation coefficient (R) of -0.082 and weighted average of 79.5%, a difference of 3.3%.
In Labor Force | Age 20-24 Correlation Summary
| Measurement | Scotch-Irish | Immigrants from Somalia |
| Minimum | 47.2% | 56.6% |
| Maximum | 100.0% | 100.0% |
| Range | 52.8% | 43.4% |
| Mean | 83.8% | 81.2% |
| Median | 81.0% | 81.1% |
| Interquartile 25% (IQ1) | 75.9% | 77.7% |
| Interquartile 75% (IQ3) | 99.5% | 85.2% |
| Interquartile Range (IQR) | 23.6% | 7.5% |
| Standard Deviation (Sample) | 13.0% | 7.7% |
| Standard Deviation (Population) | 12.9% | 7.7% |
Similar Demographics by In Labor Force | Age 20-24
Demographics Similar to Scotch-Irish by In Labor Force | Age 20-24
In terms of in labor force | age 20-24, the demographic groups most similar to Scotch-Irish are Hawaiian (77.0%, a difference of 0.030%), Kenyan (77.0%, a difference of 0.040%), Chippewa (77.1%, a difference of 0.050%), European (77.1%, a difference of 0.060%), and Immigrants from Liberia (77.1%, a difference of 0.070%).
| Demographics | Rating | Rank | In Labor Force | Age 20-24 |
| Indonesians | 100.0 /100 | #52 | Exceptional 77.2% |
| Immigrants | Azores | 100.0 /100 | #53 | Exceptional 77.2% |
| Celtics | 99.9 /100 | #54 | Exceptional 77.1% |
| Immigrants | Liberia | 99.9 /100 | #55 | Exceptional 77.1% |
| Europeans | 99.9 /100 | #56 | Exceptional 77.1% |
| Chippewa | 99.9 /100 | #57 | Exceptional 77.1% |
| Hawaiians | 99.9 /100 | #58 | Exceptional 77.0% |
| Scotch-Irish | 99.9 /100 | #59 | Exceptional 77.0% |
| Kenyans | 99.9 /100 | #60 | Exceptional 77.0% |
| Immigrants | Eritrea | 99.9 /100 | #61 | Exceptional 77.0% |
| Immigrants | Kenya | 99.9 /100 | #62 | Exceptional 77.0% |
| Lithuanians | 99.9 /100 | #63 | Exceptional 77.0% |
| Whites/Caucasians | 99.9 /100 | #64 | Exceptional 76.9% |
| Crow | 99.9 /100 | #65 | Exceptional 76.9% |
| Icelanders | 99.9 /100 | #66 | Exceptional 76.9% |
Demographics Similar to Immigrants from Somalia by In Labor Force | Age 20-24
In terms of in labor force | age 20-24, the demographic groups most similar to Immigrants from Somalia are Somali (79.3%, a difference of 0.36%), Alaskan Athabascan (79.1%, a difference of 0.55%), Aleut (79.0%, a difference of 0.69%), Danish (79.0%, a difference of 0.70%), and Luxembourger (79.0%, a difference of 0.74%).
| Demographics | Rating | Rank | In Labor Force | Age 20-24 |
| Norwegians | 100.0 /100 | #1 | Exceptional 80.1% |
| Immigrants | Somalia | 100.0 /100 | #2 | Exceptional 79.5% |
| Somalis | 100.0 /100 | #3 | Exceptional 79.3% |
| Alaskan Athabascans | 100.0 /100 | #4 | Exceptional 79.1% |
| Aleuts | 100.0 /100 | #5 | Exceptional 79.0% |
| Danes | 100.0 /100 | #6 | Exceptional 79.0% |
| Luxembourgers | 100.0 /100 | #7 | Exceptional 79.0% |
| Immigrants | Cabo Verde | 100.0 /100 | #8 | Exceptional 78.9% |
| Swedes | 100.0 /100 | #9 | Exceptional 78.8% |
| Slovenes | 100.0 /100 | #10 | Exceptional 78.7% |
| Finns | 100.0 /100 | #11 | Exceptional 78.7% |
| Germans | 100.0 /100 | #12 | Exceptional 78.6% |
| Scandinavians | 100.0 /100 | #13 | Exceptional 78.5% |
| Czechs | 100.0 /100 | #14 | Exceptional 78.5% |
| Sudanese | 100.0 /100 | #15 | Exceptional 78.4% |