Immigrants from Morocco vs Immigrants from Ecuador In Labor Force | Age 20-24
COMPARE
Immigrants from Morocco
Immigrants from Ecuador
In Labor Force | Age 20-24
In Labor Force | Age 20-24 Comparison
Immigrants from Morocco
Immigrants from Ecuador
75.9%
IN LABOR FORCE | AGE 20-24
95.8/ 100
METRIC RATING
110th/ 347
METRIC RANK
72.3%
IN LABOR FORCE | AGE 20-24
0.0/ 100
METRIC RATING
307th/ 347
METRIC RANK
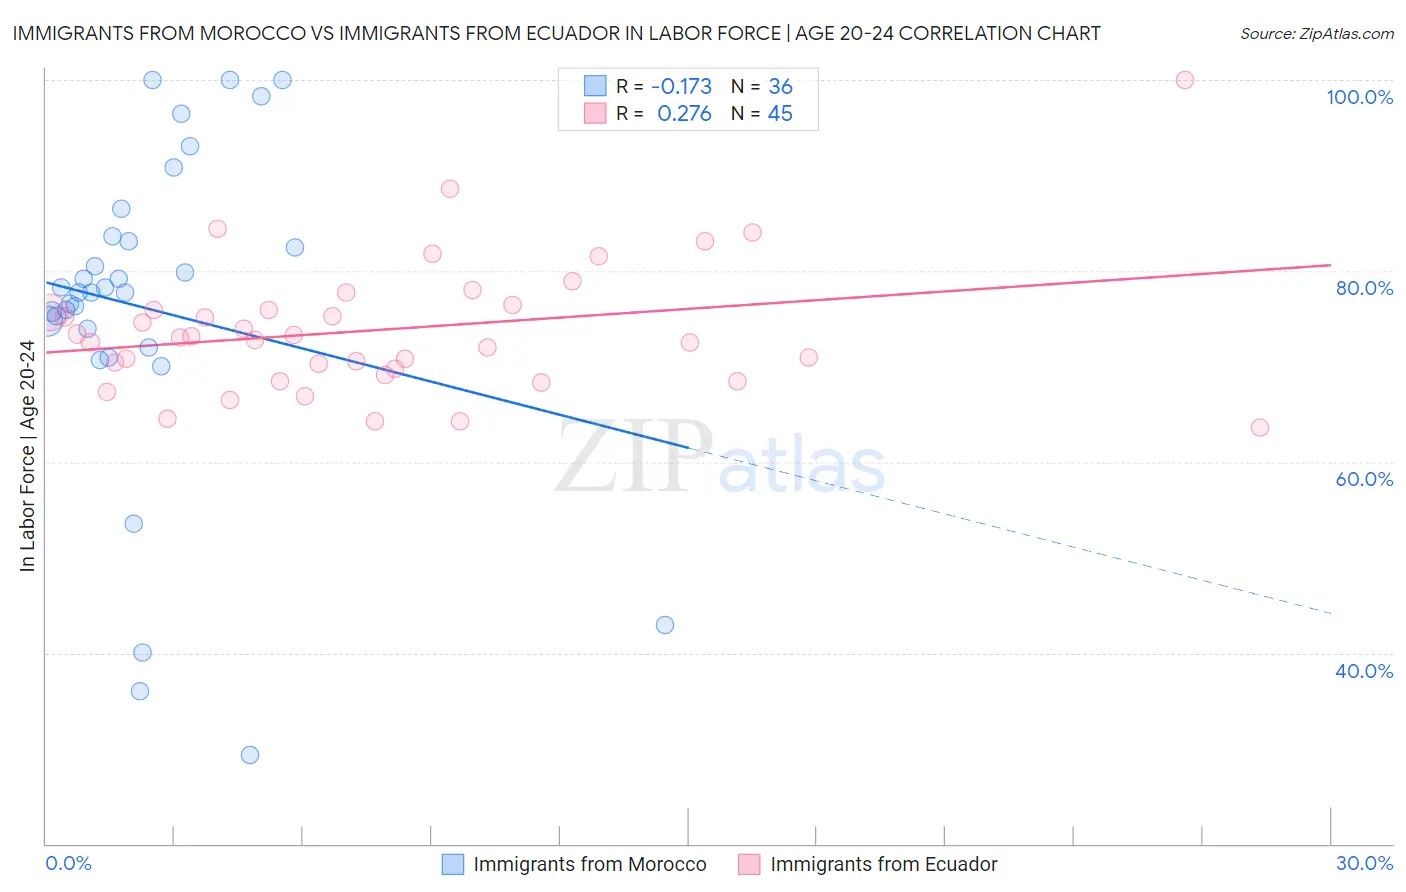
Immigrants from Morocco vs Immigrants from Ecuador In Labor Force | Age 20-24 Correlation Chart
The statistical analysis conducted on geographies consisting of 178,862,566 people shows a poor negative correlation between the proportion of Immigrants from Morocco and labor force participation rate among population between the ages 20 and 24 in the United States with a correlation coefficient (R) of -0.173 and weighted average of 75.9%. Similarly, the statistical analysis conducted on geographies consisting of 270,992,575 people shows a weak positive correlation between the proportion of Immigrants from Ecuador and labor force participation rate among population between the ages 20 and 24 in the United States with a correlation coefficient (R) of 0.276 and weighted average of 72.3%, a difference of 5.0%.
In Labor Force | Age 20-24 Correlation Summary
| Measurement | Immigrants from Morocco | Immigrants from Ecuador |
| Minimum | 29.3% | 63.6% |
| Maximum | 100.0% | 100.0% |
| Range | 70.7% | 36.4% |
| Mean | 76.0% | 73.9% |
| Median | 77.8% | 73.1% |
| Interquartile 25% (IQ1) | 72.9% | 69.4% |
| Interquartile 75% (IQ3) | 83.4% | 76.2% |
| Interquartile Range (IQR) | 10.5% | 6.7% |
| Standard Deviation (Sample) | 17.1% | 7.0% |
| Standard Deviation (Population) | 16.9% | 6.9% |
Similar Demographics by In Labor Force | Age 20-24
Demographics Similar to Immigrants from Morocco by In Labor Force | Age 20-24
In terms of in labor force | age 20-24, the demographic groups most similar to Immigrants from Morocco are Cherokee (75.9%, a difference of 0.0%), Ukrainian (75.9%, a difference of 0.010%), Immigrants from Canada (75.9%, a difference of 0.020%), Immigrants from Netherlands (75.9%, a difference of 0.050%), and Immigrants from Zimbabwe (75.9%, a difference of 0.060%).
| Demographics | Rating | Rank | In Labor Force | Age 20-24 |
| Immigrants | North Macedonia | 97.5 /100 | #103 | Exceptional 76.1% |
| Macedonians | 97.2 /100 | #104 | Exceptional 76.0% |
| Immigrants | Nepal | 97.2 /100 | #105 | Exceptional 76.0% |
| Immigrants | Uganda | 97.1 /100 | #106 | Exceptional 76.0% |
| Greeks | 96.9 /100 | #107 | Exceptional 76.0% |
| Iraqis | 96.6 /100 | #108 | Exceptional 76.0% |
| Cherokee | 95.8 /100 | #109 | Exceptional 75.9% |
| Immigrants | Morocco | 95.8 /100 | #110 | Exceptional 75.9% |
| Ukrainians | 95.7 /100 | #111 | Exceptional 75.9% |
| Immigrants | Canada | 95.6 /100 | #112 | Exceptional 75.9% |
| Immigrants | Netherlands | 95.3 /100 | #113 | Exceptional 75.9% |
| Immigrants | Zimbabwe | 95.1 /100 | #114 | Exceptional 75.9% |
| Alaska Natives | 95.1 /100 | #115 | Exceptional 75.9% |
| Immigrants | North America | 95.0 /100 | #116 | Exceptional 75.9% |
| Assyrians/Chaldeans/Syriacs | 94.9 /100 | #117 | Exceptional 75.9% |
Demographics Similar to Immigrants from Ecuador by In Labor Force | Age 20-24
In terms of in labor force | age 20-24, the demographic groups most similar to Immigrants from Ecuador are Soviet Union (72.3%, a difference of 0.010%), Tsimshian (72.3%, a difference of 0.010%), Immigrants from Jamaica (72.4%, a difference of 0.15%), Immigrants from Singapore (72.4%, a difference of 0.17%), and Immigrants from West Indies (72.4%, a difference of 0.20%).
| Demographics | Rating | Rank | In Labor Force | Age 20-24 |
| Armenians | 0.0 /100 | #300 | Tragic 72.5% |
| Cubans | 0.0 /100 | #301 | Tragic 72.5% |
| Natives/Alaskans | 0.0 /100 | #302 | Tragic 72.4% |
| Ecuadorians | 0.0 /100 | #303 | Tragic 72.4% |
| Immigrants | West Indies | 0.0 /100 | #304 | Tragic 72.4% |
| Immigrants | Singapore | 0.0 /100 | #305 | Tragic 72.4% |
| Immigrants | Jamaica | 0.0 /100 | #306 | Tragic 72.4% |
| Immigrants | Ecuador | 0.0 /100 | #307 | Tragic 72.3% |
| Soviet Union | 0.0 /100 | #308 | Tragic 72.3% |
| Tsimshian | 0.0 /100 | #309 | Tragic 72.3% |
| Immigrants | Cuba | 0.0 /100 | #310 | Tragic 72.0% |
| Apache | 0.0 /100 | #311 | Tragic 72.0% |
| Immigrants | Caribbean | 0.0 /100 | #312 | Tragic 71.9% |
| Immigrants | Dominica | 0.0 /100 | #313 | Tragic 71.9% |
| Indians (Asian) | 0.0 /100 | #314 | Tragic 71.9% |