Immigrants from Lebanon vs Tlingit-Haida In Labor Force | Age 25-29
COMPARE
Immigrants from Lebanon
Tlingit-Haida
In Labor Force | Age 25-29
In Labor Force | Age 25-29 Comparison
Immigrants from Lebanon
Tlingit-Haida
83.4%
IN LABOR FORCE | AGE 25-29
0.0/ 100
METRIC RATING
268th/ 347
METRIC RANK
84.4%
IN LABOR FORCE | AGE 25-29
19.3/ 100
METRIC RATING
197th/ 347
METRIC RANK
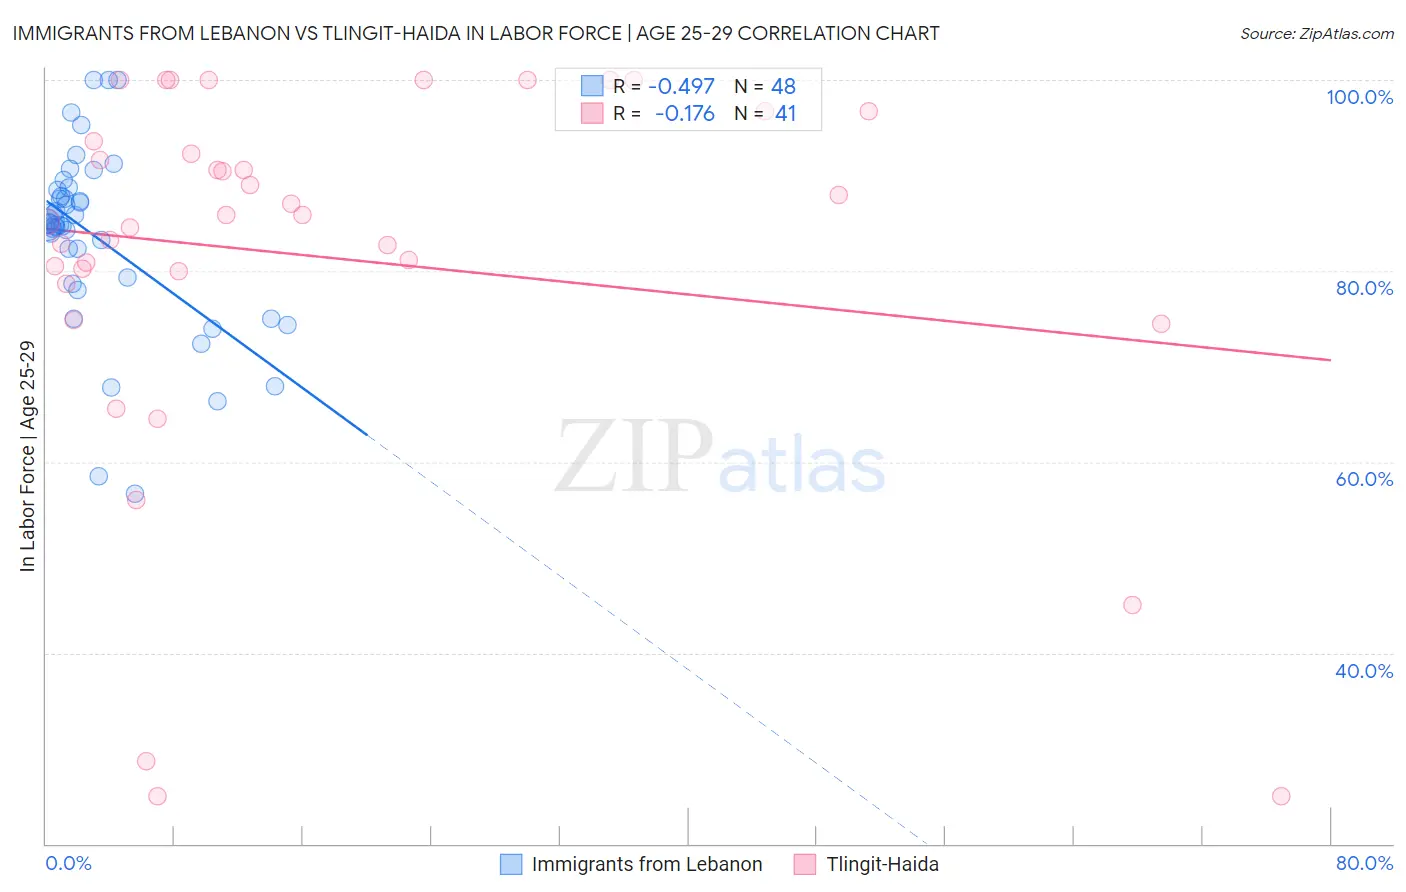
Immigrants from Lebanon vs Tlingit-Haida In Labor Force | Age 25-29 Correlation Chart
The statistical analysis conducted on geographies consisting of 217,137,531 people shows a moderate negative correlation between the proportion of Immigrants from Lebanon and labor force participation rate among population between the ages 25 and 29 in the United States with a correlation coefficient (R) of -0.497 and weighted average of 83.4%. Similarly, the statistical analysis conducted on geographies consisting of 60,865,267 people shows a poor negative correlation between the proportion of Tlingit-Haida and labor force participation rate among population between the ages 25 and 29 in the United States with a correlation coefficient (R) of -0.176 and weighted average of 84.4%, a difference of 1.2%.
In Labor Force | Age 25-29 Correlation Summary
| Measurement | Immigrants from Lebanon | Tlingit-Haida |
| Minimum | 56.7% | 25.0% |
| Maximum | 100.0% | 100.0% |
| Range | 43.3% | 75.0% |
| Mean | 83.5% | 81.4% |
| Median | 85.0% | 85.8% |
| Interquartile 25% (IQ1) | 79.0% | 79.3% |
| Interquartile 75% (IQ3) | 88.2% | 95.2% |
| Interquartile Range (IQR) | 9.2% | 15.8% |
| Standard Deviation (Sample) | 9.5% | 19.9% |
| Standard Deviation (Population) | 9.4% | 19.6% |
Similar Demographics by In Labor Force | Age 25-29
Demographics Similar to Immigrants from Lebanon by In Labor Force | Age 25-29
In terms of in labor force | age 25-29, the demographic groups most similar to Immigrants from Lebanon are Immigrants from Barbados (83.4%, a difference of 0.0%), Spanish American (83.4%, a difference of 0.010%), Aleut (83.4%, a difference of 0.020%), Basque (83.4%, a difference of 0.020%), and Honduran (83.4%, a difference of 0.040%).
| Demographics | Rating | Rank | In Labor Force | Age 25-29 |
| Pennsylvania Germans | 0.1 /100 | #261 | Tragic 83.6% |
| Immigrants | Fiji | 0.1 /100 | #262 | Tragic 83.6% |
| West Indians | 0.1 /100 | #263 | Tragic 83.5% |
| Puget Sound Salish | 0.1 /100 | #264 | Tragic 83.5% |
| Cubans | 0.1 /100 | #265 | Tragic 83.5% |
| Aleuts | 0.0 /100 | #266 | Tragic 83.4% |
| Spanish Americans | 0.0 /100 | #267 | Tragic 83.4% |
| Immigrants | Lebanon | 0.0 /100 | #268 | Tragic 83.4% |
| Immigrants | Barbados | 0.0 /100 | #269 | Tragic 83.4% |
| Basques | 0.0 /100 | #270 | Tragic 83.4% |
| Hondurans | 0.0 /100 | #271 | Tragic 83.4% |
| Immigrants | Caribbean | 0.0 /100 | #272 | Tragic 83.4% |
| Immigrants | Dominica | 0.0 /100 | #273 | Tragic 83.4% |
| Marshallese | 0.0 /100 | #274 | Tragic 83.3% |
| Samoans | 0.0 /100 | #275 | Tragic 83.3% |
Demographics Similar to Tlingit-Haida by In Labor Force | Age 25-29
In terms of in labor force | age 25-29, the demographic groups most similar to Tlingit-Haida are Immigrants from South Eastern Asia (84.4%, a difference of 0.0%), Immigrants from Iraq (84.4%, a difference of 0.0%), Immigrants from Germany (84.4%, a difference of 0.010%), Portuguese (84.4%, a difference of 0.020%), and Immigrants from Israel (84.4%, a difference of 0.020%).
| Demographics | Rating | Rank | In Labor Force | Age 25-29 |
| Welsh | 31.1 /100 | #190 | Fair 84.5% |
| Zimbabweans | 28.7 /100 | #191 | Fair 84.5% |
| English | 25.8 /100 | #192 | Fair 84.5% |
| South American Indians | 25.0 /100 | #193 | Fair 84.5% |
| Portuguese | 21.2 /100 | #194 | Fair 84.4% |
| Immigrants | Israel | 20.8 /100 | #195 | Fair 84.4% |
| Immigrants | South Eastern Asia | 19.5 /100 | #196 | Poor 84.4% |
| Tlingit-Haida | 19.3 /100 | #197 | Poor 84.4% |
| Immigrants | Iraq | 19.0 /100 | #198 | Poor 84.4% |
| Immigrants | Germany | 18.3 /100 | #199 | Poor 84.4% |
| Immigrants | Kazakhstan | 17.5 /100 | #200 | Poor 84.4% |
| Laotians | 16.6 /100 | #201 | Poor 84.4% |
| Afghans | 15.9 /100 | #202 | Poor 84.4% |
| Immigrants | Afghanistan | 15.6 /100 | #203 | Poor 84.4% |
| Venezuelans | 15.1 /100 | #204 | Poor 84.4% |