Immigrants from Lebanon vs Yuman In Labor Force | Age 25-29
COMPARE
Immigrants from Lebanon
Yuman
In Labor Force | Age 25-29
In Labor Force | Age 25-29 Comparison
Immigrants from Lebanon
Yuman
83.4%
IN LABOR FORCE | AGE 25-29
0.0/ 100
METRIC RATING
268th/ 347
METRIC RANK
79.3%
IN LABOR FORCE | AGE 25-29
0.0/ 100
METRIC RATING
334th/ 347
METRIC RANK
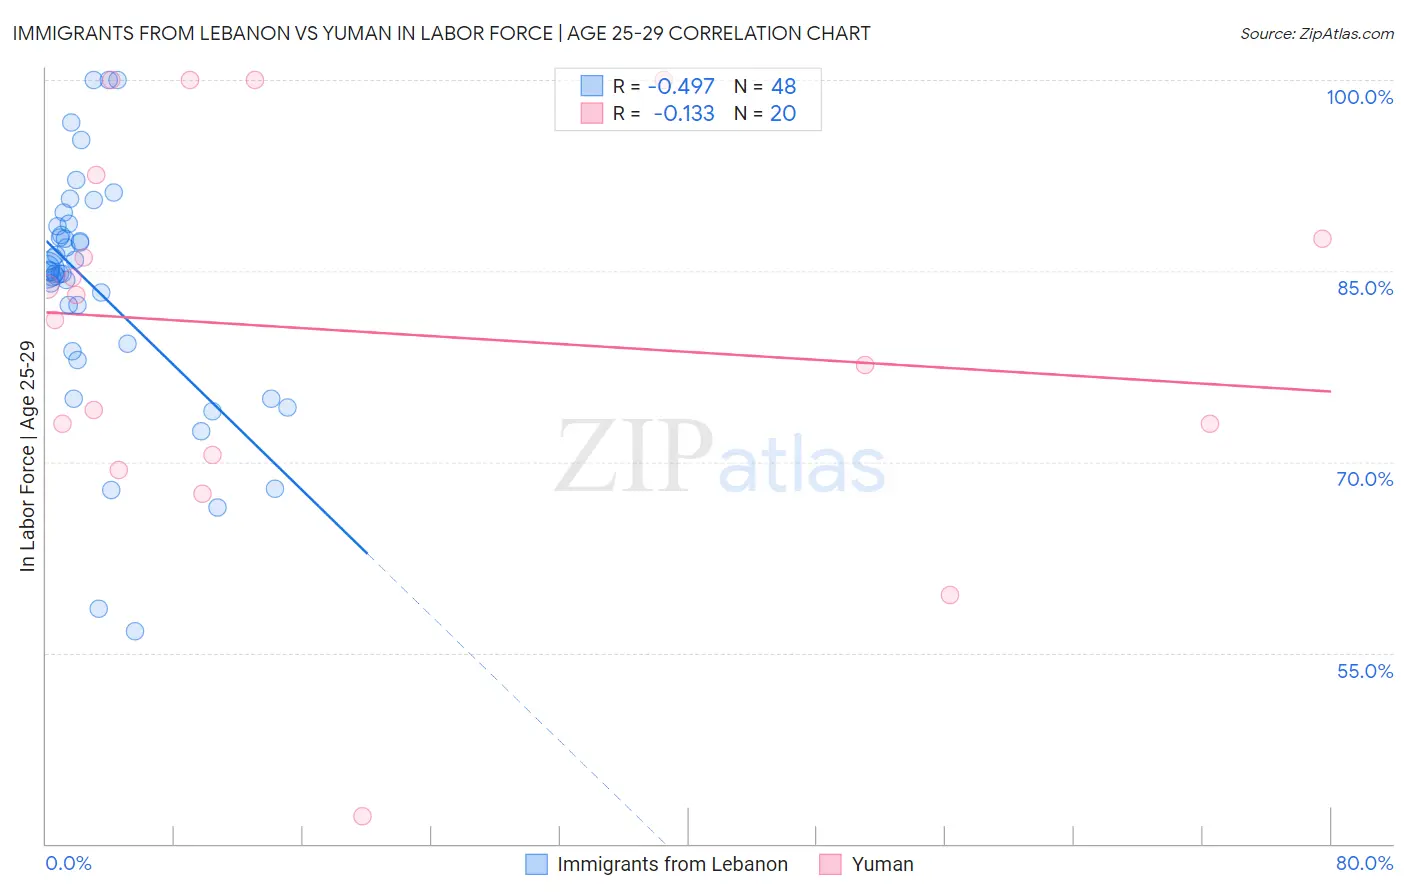
Immigrants from Lebanon vs Yuman In Labor Force | Age 25-29 Correlation Chart
The statistical analysis conducted on geographies consisting of 217,137,531 people shows a moderate negative correlation between the proportion of Immigrants from Lebanon and labor force participation rate among population between the ages 25 and 29 in the United States with a correlation coefficient (R) of -0.497 and weighted average of 83.4%. Similarly, the statistical analysis conducted on geographies consisting of 40,683,132 people shows a poor negative correlation between the proportion of Yuman and labor force participation rate among population between the ages 25 and 29 in the United States with a correlation coefficient (R) of -0.133 and weighted average of 79.3%, a difference of 5.1%.
In Labor Force | Age 25-29 Correlation Summary
| Measurement | Immigrants from Lebanon | Yuman |
| Minimum | 56.7% | 42.2% |
| Maximum | 100.0% | 100.0% |
| Range | 43.3% | 57.8% |
| Mean | 83.5% | 80.3% |
| Median | 85.0% | 82.1% |
| Interquartile 25% (IQ1) | 79.0% | 71.7% |
| Interquartile 75% (IQ3) | 88.2% | 90.0% |
| Interquartile Range (IQR) | 9.2% | 18.3% |
| Standard Deviation (Sample) | 9.5% | 14.9% |
| Standard Deviation (Population) | 9.4% | 14.6% |
Similar Demographics by In Labor Force | Age 25-29
Demographics Similar to Immigrants from Lebanon by In Labor Force | Age 25-29
In terms of in labor force | age 25-29, the demographic groups most similar to Immigrants from Lebanon are Immigrants from Barbados (83.4%, a difference of 0.0%), Spanish American (83.4%, a difference of 0.010%), Aleut (83.4%, a difference of 0.020%), Basque (83.4%, a difference of 0.020%), and Honduran (83.4%, a difference of 0.040%).
| Demographics | Rating | Rank | In Labor Force | Age 25-29 |
| Pennsylvania Germans | 0.1 /100 | #261 | Tragic 83.6% |
| Immigrants | Fiji | 0.1 /100 | #262 | Tragic 83.6% |
| West Indians | 0.1 /100 | #263 | Tragic 83.5% |
| Puget Sound Salish | 0.1 /100 | #264 | Tragic 83.5% |
| Cubans | 0.1 /100 | #265 | Tragic 83.5% |
| Aleuts | 0.0 /100 | #266 | Tragic 83.4% |
| Spanish Americans | 0.0 /100 | #267 | Tragic 83.4% |
| Immigrants | Lebanon | 0.0 /100 | #268 | Tragic 83.4% |
| Immigrants | Barbados | 0.0 /100 | #269 | Tragic 83.4% |
| Basques | 0.0 /100 | #270 | Tragic 83.4% |
| Hondurans | 0.0 /100 | #271 | Tragic 83.4% |
| Immigrants | Caribbean | 0.0 /100 | #272 | Tragic 83.4% |
| Immigrants | Dominica | 0.0 /100 | #273 | Tragic 83.4% |
| Marshallese | 0.0 /100 | #274 | Tragic 83.3% |
| Samoans | 0.0 /100 | #275 | Tragic 83.3% |
Demographics Similar to Yuman by In Labor Force | Age 25-29
In terms of in labor force | age 25-29, the demographic groups most similar to Yuman are Native/Alaskan (79.3%, a difference of 0.080%), Apache (79.2%, a difference of 0.16%), Sioux (79.7%, a difference of 0.42%), Inupiat (79.8%, a difference of 0.53%), and Crow (78.6%, a difference of 0.91%).
| Demographics | Rating | Rank | In Labor Force | Age 25-29 |
| Ute | 0.0 /100 | #327 | Tragic 80.8% |
| Creek | 0.0 /100 | #328 | Tragic 80.7% |
| Yakama | 0.0 /100 | #329 | Tragic 80.6% |
| Puerto Ricans | 0.0 /100 | #330 | Tragic 80.4% |
| Cheyenne | 0.0 /100 | #331 | Tragic 80.3% |
| Inupiat | 0.0 /100 | #332 | Tragic 79.8% |
| Sioux | 0.0 /100 | #333 | Tragic 79.7% |
| Yuman | 0.0 /100 | #334 | Tragic 79.3% |
| Natives/Alaskans | 0.0 /100 | #335 | Tragic 79.3% |
| Apache | 0.0 /100 | #336 | Tragic 79.2% |
| Crow | 0.0 /100 | #337 | Tragic 78.6% |
| Lumbee | 0.0 /100 | #338 | Tragic 78.3% |
| Immigrants | Yemen | 0.0 /100 | #339 | Tragic 78.2% |
| Paiute | 0.0 /100 | #340 | Tragic 78.1% |
| Tohono O'odham | 0.0 /100 | #341 | Tragic 77.5% |