Immigrants from Lebanon vs Tlingit-Haida College, Under 1 year
COMPARE
Immigrants from Lebanon
Tlingit-Haida
College, Under 1 year
College, Under 1 year Comparison
Immigrants from Lebanon
Tlingit-Haida
68.3%
COLLEGE, UNDER 1 YEAR
98.3/ 100
METRIC RATING
86th/ 347
METRIC RANK
65.9%
COLLEGE, UNDER 1 YEAR
66.4/ 100
METRIC RATING
159th/ 347
METRIC RANK
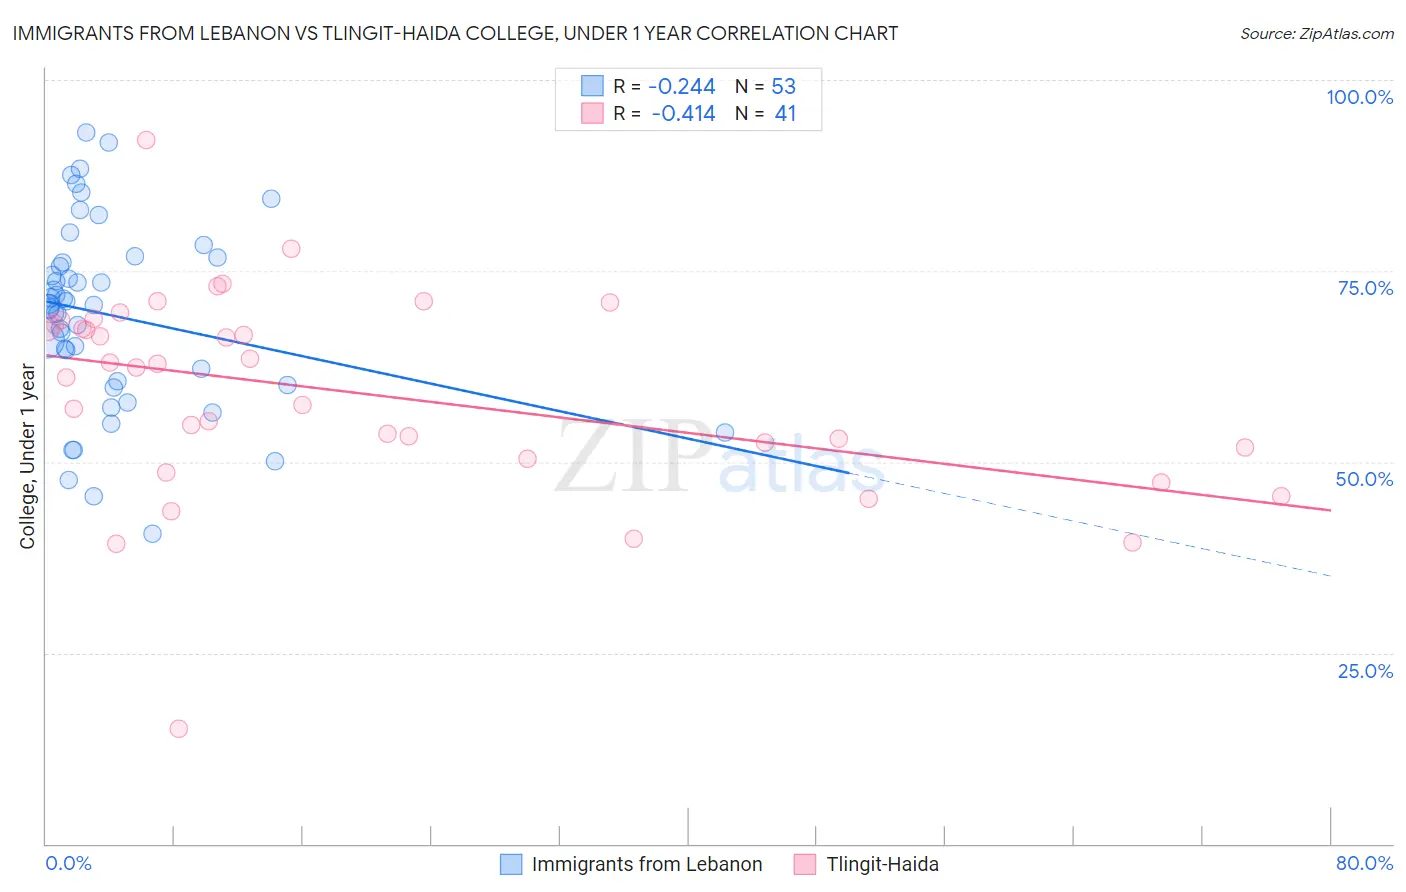
Immigrants from Lebanon vs Tlingit-Haida College, Under 1 year Correlation Chart
The statistical analysis conducted on geographies consisting of 217,164,247 people shows a weak negative correlation between the proportion of Immigrants from Lebanon and percentage of population with at least college, under 1 year education in the United States with a correlation coefficient (R) of -0.244 and weighted average of 68.3%. Similarly, the statistical analysis conducted on geographies consisting of 60,871,919 people shows a moderate negative correlation between the proportion of Tlingit-Haida and percentage of population with at least college, under 1 year education in the United States with a correlation coefficient (R) of -0.414 and weighted average of 65.9%, a difference of 3.7%.
College, Under 1 year Correlation Summary
| Measurement | Immigrants from Lebanon | Tlingit-Haida |
| Minimum | 40.6% | 15.0% |
| Maximum | 93.2% | 92.1% |
| Range | 52.6% | 77.1% |
| Mean | 69.2% | 59.1% |
| Median | 70.6% | 62.3% |
| Interquartile 25% (IQ1) | 60.3% | 51.2% |
| Interquartile 75% (IQ3) | 76.5% | 68.3% |
| Interquartile Range (IQR) | 16.1% | 17.2% |
| Standard Deviation (Sample) | 12.1% | 13.5% |
| Standard Deviation (Population) | 12.0% | 13.4% |
Similar Demographics by College, Under 1 year
Demographics Similar to Immigrants from Lebanon by College, Under 1 year
In terms of college, under 1 year, the demographic groups most similar to Immigrants from Lebanon are Egyptian (68.3%, a difference of 0.0%), Immigrants from Hungary (68.3%, a difference of 0.010%), Chinese (68.3%, a difference of 0.020%), Argentinean (68.4%, a difference of 0.030%), and Croatian (68.3%, a difference of 0.040%).
| Demographics | Rating | Rank | College, Under 1 year |
| Greeks | 98.6 /100 | #79 | Exceptional 68.5% |
| Immigrants | Spain | 98.5 /100 | #80 | Exceptional 68.4% |
| Immigrants | Greece | 98.5 /100 | #81 | Exceptional 68.4% |
| Norwegians | 98.4 /100 | #82 | Exceptional 68.4% |
| Argentineans | 98.4 /100 | #83 | Exceptional 68.4% |
| Immigrants | Hungary | 98.3 /100 | #84 | Exceptional 68.3% |
| Egyptians | 98.3 /100 | #85 | Exceptional 68.3% |
| Immigrants | Lebanon | 98.3 /100 | #86 | Exceptional 68.3% |
| Chinese | 98.3 /100 | #87 | Exceptional 68.3% |
| Croatians | 98.2 /100 | #88 | Exceptional 68.3% |
| Ethiopians | 98.2 /100 | #89 | Exceptional 68.3% |
| Icelanders | 98.1 /100 | #90 | Exceptional 68.3% |
| Europeans | 98.1 /100 | #91 | Exceptional 68.2% |
| Luxembourgers | 98.1 /100 | #92 | Exceptional 68.2% |
| Romanians | 97.9 /100 | #93 | Exceptional 68.2% |
Demographics Similar to Tlingit-Haida by College, Under 1 year
In terms of college, under 1 year, the demographic groups most similar to Tlingit-Haida are Albanian (65.9%, a difference of 0.010%), Brazilian (65.9%, a difference of 0.020%), Celtic (65.9%, a difference of 0.050%), Korean (65.9%, a difference of 0.050%), and Sierra Leonean (66.0%, a difference of 0.070%).
| Demographics | Rating | Rank | College, Under 1 year |
| Sudanese | 74.1 /100 | #152 | Good 66.2% |
| Belgians | 73.7 /100 | #153 | Good 66.2% |
| Immigrants | Eritrea | 71.9 /100 | #154 | Good 66.1% |
| Irish | 70.3 /100 | #155 | Good 66.0% |
| Welsh | 69.9 /100 | #156 | Good 66.0% |
| Sierra Leoneans | 67.8 /100 | #157 | Good 66.0% |
| Celtics | 67.3 /100 | #158 | Good 65.9% |
| Tlingit-Haida | 66.4 /100 | #159 | Good 65.9% |
| Albanians | 66.1 /100 | #160 | Good 65.9% |
| Brazilians | 66.0 /100 | #161 | Good 65.9% |
| Koreans | 65.3 /100 | #162 | Good 65.9% |
| Somalis | 62.7 /100 | #163 | Good 65.8% |
| Czechoslovakians | 62.6 /100 | #164 | Good 65.8% |
| Immigrants | Uzbekistan | 61.6 /100 | #165 | Good 65.8% |
| Moroccans | 56.7 /100 | #166 | Average 65.6% |