Immigrants from Lebanon vs Immigrants from Senegal In Labor Force | Age 25-29
COMPARE
Immigrants from Lebanon
Immigrants from Senegal
In Labor Force | Age 25-29
In Labor Force | Age 25-29 Comparison
Immigrants from Lebanon
Immigrants from Senegal
83.4%
IN LABOR FORCE | AGE 25-29
0.0/ 100
METRIC RATING
268th/ 347
METRIC RANK
84.8%
IN LABOR FORCE | AGE 25-29
68.3/ 100
METRIC RATING
145th/ 347
METRIC RANK
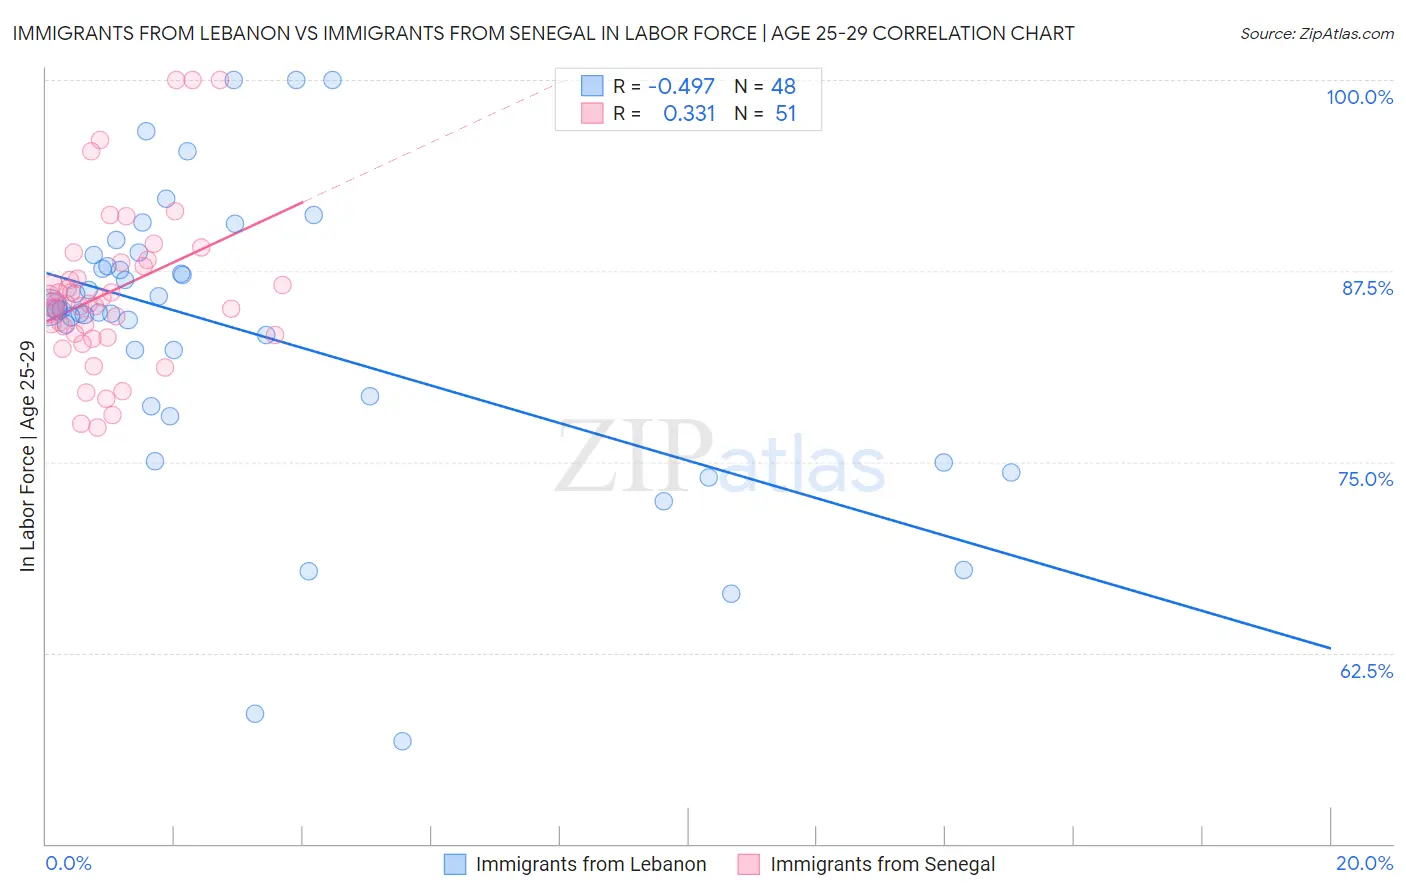
Immigrants from Lebanon vs Immigrants from Senegal In Labor Force | Age 25-29 Correlation Chart
The statistical analysis conducted on geographies consisting of 217,137,531 people shows a moderate negative correlation between the proportion of Immigrants from Lebanon and labor force participation rate among population between the ages 25 and 29 in the United States with a correlation coefficient (R) of -0.497 and weighted average of 83.4%. Similarly, the statistical analysis conducted on geographies consisting of 90,123,722 people shows a mild positive correlation between the proportion of Immigrants from Senegal and labor force participation rate among population between the ages 25 and 29 in the United States with a correlation coefficient (R) of 0.331 and weighted average of 84.8%, a difference of 1.6%.
In Labor Force | Age 25-29 Correlation Summary
| Measurement | Immigrants from Lebanon | Immigrants from Senegal |
| Minimum | 56.7% | 77.2% |
| Maximum | 100.0% | 100.0% |
| Range | 43.3% | 22.8% |
| Mean | 83.5% | 86.1% |
| Median | 85.0% | 85.4% |
| Interquartile 25% (IQ1) | 79.0% | 83.3% |
| Interquartile 75% (IQ3) | 88.2% | 88.1% |
| Interquartile Range (IQR) | 9.2% | 4.8% |
| Standard Deviation (Sample) | 9.5% | 5.2% |
| Standard Deviation (Population) | 9.4% | 5.2% |
Similar Demographics by In Labor Force | Age 25-29
Demographics Similar to Immigrants from Lebanon by In Labor Force | Age 25-29
In terms of in labor force | age 25-29, the demographic groups most similar to Immigrants from Lebanon are Immigrants from Barbados (83.4%, a difference of 0.0%), Spanish American (83.4%, a difference of 0.010%), Aleut (83.4%, a difference of 0.020%), Basque (83.4%, a difference of 0.020%), and Honduran (83.4%, a difference of 0.040%).
| Demographics | Rating | Rank | In Labor Force | Age 25-29 |
| Pennsylvania Germans | 0.1 /100 | #261 | Tragic 83.6% |
| Immigrants | Fiji | 0.1 /100 | #262 | Tragic 83.6% |
| West Indians | 0.1 /100 | #263 | Tragic 83.5% |
| Puget Sound Salish | 0.1 /100 | #264 | Tragic 83.5% |
| Cubans | 0.1 /100 | #265 | Tragic 83.5% |
| Aleuts | 0.0 /100 | #266 | Tragic 83.4% |
| Spanish Americans | 0.0 /100 | #267 | Tragic 83.4% |
| Immigrants | Lebanon | 0.0 /100 | #268 | Tragic 83.4% |
| Immigrants | Barbados | 0.0 /100 | #269 | Tragic 83.4% |
| Basques | 0.0 /100 | #270 | Tragic 83.4% |
| Hondurans | 0.0 /100 | #271 | Tragic 83.4% |
| Immigrants | Caribbean | 0.0 /100 | #272 | Tragic 83.4% |
| Immigrants | Dominica | 0.0 /100 | #273 | Tragic 83.4% |
| Marshallese | 0.0 /100 | #274 | Tragic 83.3% |
| Samoans | 0.0 /100 | #275 | Tragic 83.3% |
Demographics Similar to Immigrants from Senegal by In Labor Force | Age 25-29
In terms of in labor force | age 25-29, the demographic groups most similar to Immigrants from Senegal are Icelander (84.8%, a difference of 0.0%), Immigrants from Asia (84.8%, a difference of 0.0%), Pakistani (84.8%, a difference of 0.010%), Sri Lankan (84.8%, a difference of 0.010%), and Immigrants from Laos (84.8%, a difference of 0.010%).
| Demographics | Rating | Rank | In Labor Force | Age 25-29 |
| Armenians | 72.7 /100 | #138 | Good 84.8% |
| Immigrants | Eastern Asia | 72.6 /100 | #139 | Good 84.8% |
| Immigrants | North America | 72.1 /100 | #140 | Good 84.8% |
| Danes | 71.9 /100 | #141 | Good 84.8% |
| Pakistanis | 70.0 /100 | #142 | Good 84.8% |
| Sri Lankans | 69.2 /100 | #143 | Good 84.8% |
| Immigrants | Laos | 69.0 /100 | #144 | Good 84.8% |
| Immigrants | Senegal | 68.3 /100 | #145 | Good 84.8% |
| Icelanders | 68.2 /100 | #146 | Good 84.8% |
| Immigrants | Asia | 68.2 /100 | #147 | Good 84.8% |
| Immigrants | England | 65.2 /100 | #148 | Good 84.7% |
| Peruvians | 64.7 /100 | #149 | Good 84.7% |
| Swiss | 64.7 /100 | #150 | Good 84.7% |
| Colombians | 62.8 /100 | #151 | Good 84.7% |
| Immigrants | Pakistan | 62.7 /100 | #152 | Good 84.7% |