Immigrants from Lebanon vs Somali In Labor Force | Age 25-29
COMPARE
Immigrants from Lebanon
Somali
In Labor Force | Age 25-29
In Labor Force | Age 25-29 Comparison
Immigrants from Lebanon
Somalis
83.4%
IN LABOR FORCE | AGE 25-29
0.0/ 100
METRIC RATING
268th/ 347
METRIC RANK
87.1%
IN LABOR FORCE | AGE 25-29
100.0/ 100
METRIC RATING
3rd/ 347
METRIC RANK
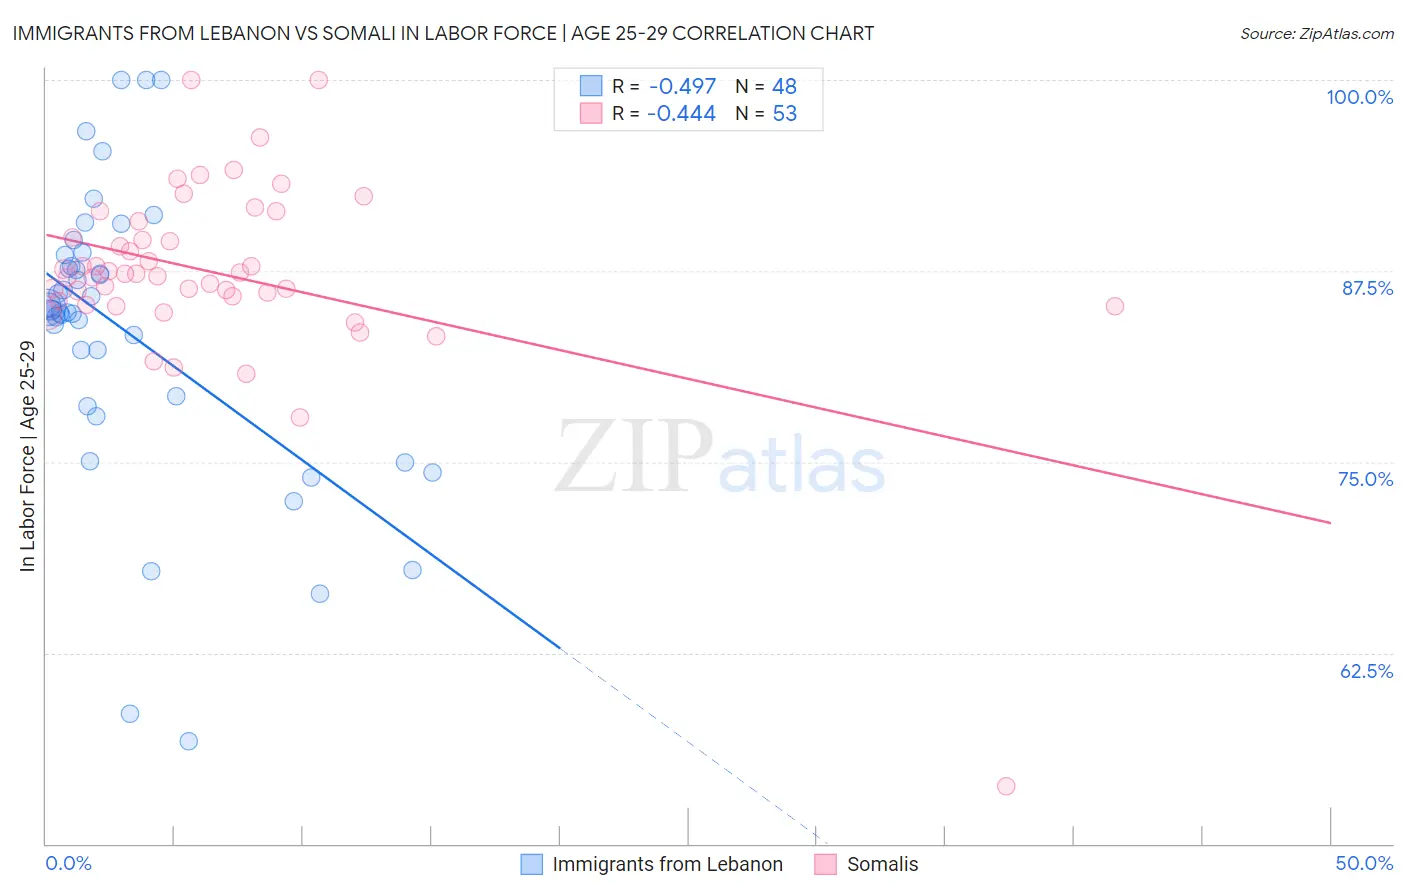
Immigrants from Lebanon vs Somali In Labor Force | Age 25-29 Correlation Chart
The statistical analysis conducted on geographies consisting of 217,137,531 people shows a moderate negative correlation between the proportion of Immigrants from Lebanon and labor force participation rate among population between the ages 25 and 29 in the United States with a correlation coefficient (R) of -0.497 and weighted average of 83.4%. Similarly, the statistical analysis conducted on geographies consisting of 99,327,159 people shows a moderate negative correlation between the proportion of Somalis and labor force participation rate among population between the ages 25 and 29 in the United States with a correlation coefficient (R) of -0.444 and weighted average of 87.1%, a difference of 4.4%.
In Labor Force | Age 25-29 Correlation Summary
| Measurement | Immigrants from Lebanon | Somali |
| Minimum | 56.7% | 53.8% |
| Maximum | 100.0% | 100.0% |
| Range | 43.3% | 46.2% |
| Mean | 83.5% | 87.4% |
| Median | 85.0% | 87.3% |
| Interquartile 25% (IQ1) | 79.0% | 85.4% |
| Interquartile 75% (IQ3) | 88.2% | 90.2% |
| Interquartile Range (IQR) | 9.2% | 4.8% |
| Standard Deviation (Sample) | 9.5% | 6.4% |
| Standard Deviation (Population) | 9.4% | 6.3% |
Similar Demographics by In Labor Force | Age 25-29
Demographics Similar to Immigrants from Lebanon by In Labor Force | Age 25-29
In terms of in labor force | age 25-29, the demographic groups most similar to Immigrants from Lebanon are Immigrants from Barbados (83.4%, a difference of 0.0%), Spanish American (83.4%, a difference of 0.010%), Aleut (83.4%, a difference of 0.020%), Basque (83.4%, a difference of 0.020%), and Honduran (83.4%, a difference of 0.040%).
| Demographics | Rating | Rank | In Labor Force | Age 25-29 |
| Pennsylvania Germans | 0.1 /100 | #261 | Tragic 83.6% |
| Immigrants | Fiji | 0.1 /100 | #262 | Tragic 83.6% |
| West Indians | 0.1 /100 | #263 | Tragic 83.5% |
| Puget Sound Salish | 0.1 /100 | #264 | Tragic 83.5% |
| Cubans | 0.1 /100 | #265 | Tragic 83.5% |
| Aleuts | 0.0 /100 | #266 | Tragic 83.4% |
| Spanish Americans | 0.0 /100 | #267 | Tragic 83.4% |
| Immigrants | Lebanon | 0.0 /100 | #268 | Tragic 83.4% |
| Immigrants | Barbados | 0.0 /100 | #269 | Tragic 83.4% |
| Basques | 0.0 /100 | #270 | Tragic 83.4% |
| Hondurans | 0.0 /100 | #271 | Tragic 83.4% |
| Immigrants | Caribbean | 0.0 /100 | #272 | Tragic 83.4% |
| Immigrants | Dominica | 0.0 /100 | #273 | Tragic 83.4% |
| Marshallese | 0.0 /100 | #274 | Tragic 83.3% |
| Samoans | 0.0 /100 | #275 | Tragic 83.3% |
Demographics Similar to Somalis by In Labor Force | Age 25-29
In terms of in labor force | age 25-29, the demographic groups most similar to Somalis are Immigrants from Somalia (87.1%, a difference of 0.010%), Carpatho Rusyn (87.0%, a difference of 0.090%), Luxembourger (86.9%, a difference of 0.19%), Slovene (86.4%, a difference of 0.80%), and Immigrants from Bosnia and Herzegovina (86.3%, a difference of 0.93%).
| Demographics | Rating | Rank | In Labor Force | Age 25-29 |
| Tsimshian | 100.0 /100 | #1 | Exceptional 88.7% |
| Immigrants | Somalia | 100.0 /100 | #2 | Exceptional 87.1% |
| Somalis | 100.0 /100 | #3 | Exceptional 87.1% |
| Carpatho Rusyns | 100.0 /100 | #4 | Exceptional 87.0% |
| Luxembourgers | 100.0 /100 | #5 | Exceptional 86.9% |
| Slovenes | 100.0 /100 | #6 | Exceptional 86.4% |
| Immigrants | Bosnia and Herzegovina | 100.0 /100 | #7 | Exceptional 86.3% |
| Immigrants | Cabo Verde | 100.0 /100 | #8 | Exceptional 86.2% |
| Ethiopians | 100.0 /100 | #9 | Exceptional 86.2% |
| Liberians | 100.0 /100 | #10 | Exceptional 86.1% |
| Immigrants | Ethiopia | 100.0 /100 | #11 | Exceptional 86.1% |
| Immigrants | Lithuania | 100.0 /100 | #12 | Exceptional 86.1% |
| Norwegians | 100.0 /100 | #13 | Exceptional 86.1% |
| Latvians | 100.0 /100 | #14 | Exceptional 86.1% |
| Bolivians | 100.0 /100 | #15 | Exceptional 86.1% |