Immigrants from Lebanon vs Immigrants from Australia In Labor Force | Age 25-29
COMPARE
Immigrants from Lebanon
Immigrants from Australia
In Labor Force | Age 25-29
In Labor Force | Age 25-29 Comparison
Immigrants from Lebanon
Immigrants from Australia
83.4%
IN LABOR FORCE | AGE 25-29
0.0/ 100
METRIC RATING
268th/ 347
METRIC RANK
85.3%
IN LABOR FORCE | AGE 25-29
98.9/ 100
METRIC RATING
72nd/ 347
METRIC RANK
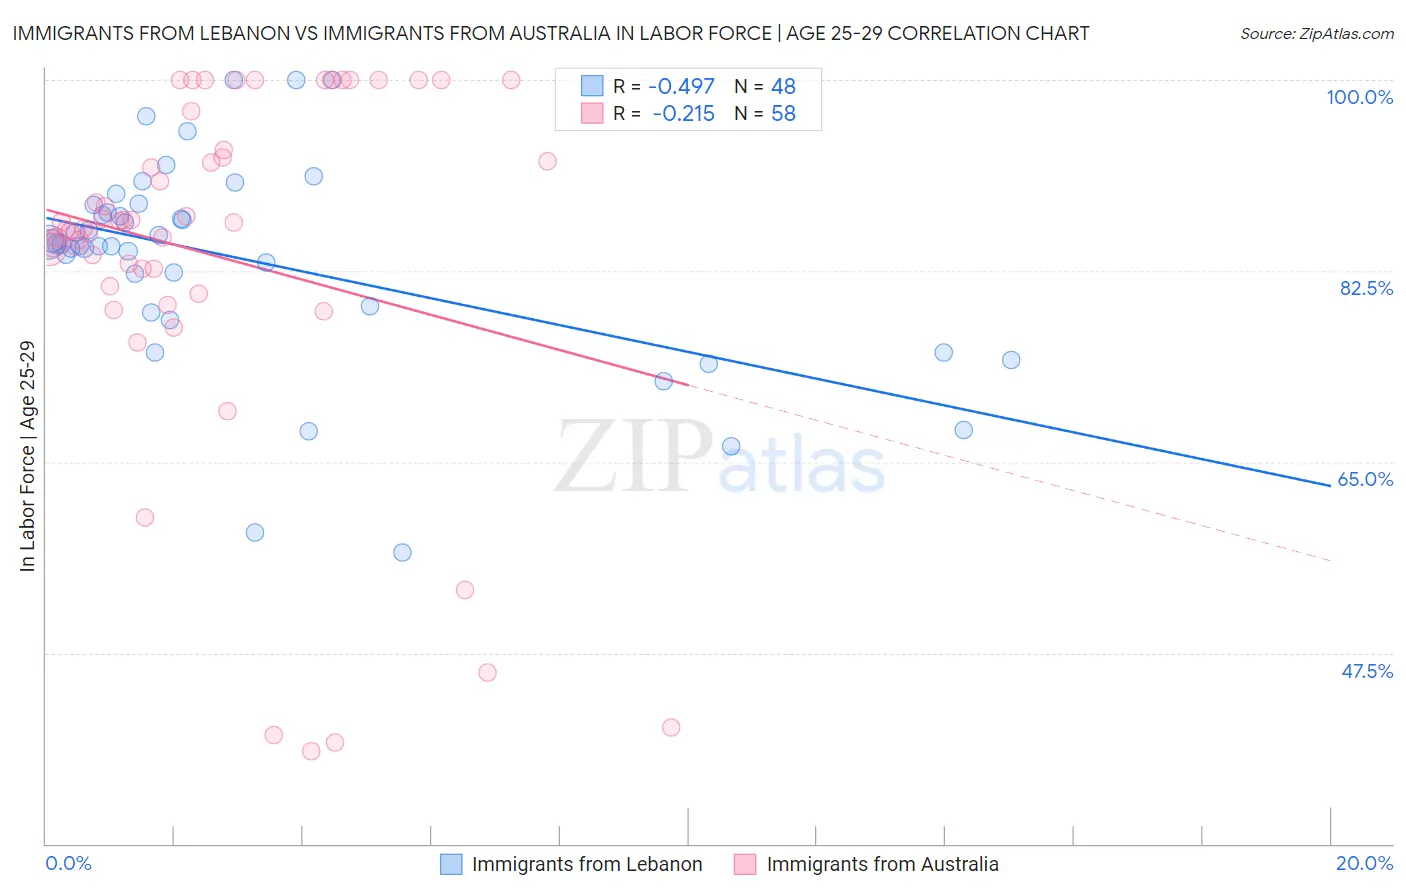
Immigrants from Lebanon vs Immigrants from Australia In Labor Force | Age 25-29 Correlation Chart
The statistical analysis conducted on geographies consisting of 217,137,531 people shows a moderate negative correlation between the proportion of Immigrants from Lebanon and labor force participation rate among population between the ages 25 and 29 in the United States with a correlation coefficient (R) of -0.497 and weighted average of 83.4%. Similarly, the statistical analysis conducted on geographies consisting of 227,173,670 people shows a weak negative correlation between the proportion of Immigrants from Australia and labor force participation rate among population between the ages 25 and 29 in the United States with a correlation coefficient (R) of -0.215 and weighted average of 85.3%, a difference of 2.3%.
In Labor Force | Age 25-29 Correlation Summary
| Measurement | Immigrants from Lebanon | Immigrants from Australia |
| Minimum | 56.7% | 38.5% |
| Maximum | 100.0% | 100.0% |
| Range | 43.3% | 61.5% |
| Mean | 83.5% | 83.9% |
| Median | 85.0% | 86.6% |
| Interquartile 25% (IQ1) | 79.0% | 81.1% |
| Interquartile 75% (IQ3) | 88.2% | 93.5% |
| Interquartile Range (IQR) | 9.2% | 12.5% |
| Standard Deviation (Sample) | 9.5% | 16.4% |
| Standard Deviation (Population) | 9.4% | 16.3% |
Similar Demographics by In Labor Force | Age 25-29
Demographics Similar to Immigrants from Lebanon by In Labor Force | Age 25-29
In terms of in labor force | age 25-29, the demographic groups most similar to Immigrants from Lebanon are Immigrants from Barbados (83.4%, a difference of 0.0%), Spanish American (83.4%, a difference of 0.010%), Aleut (83.4%, a difference of 0.020%), Basque (83.4%, a difference of 0.020%), and Honduran (83.4%, a difference of 0.040%).
| Demographics | Rating | Rank | In Labor Force | Age 25-29 |
| Pennsylvania Germans | 0.1 /100 | #261 | Tragic 83.6% |
| Immigrants | Fiji | 0.1 /100 | #262 | Tragic 83.6% |
| West Indians | 0.1 /100 | #263 | Tragic 83.5% |
| Puget Sound Salish | 0.1 /100 | #264 | Tragic 83.5% |
| Cubans | 0.1 /100 | #265 | Tragic 83.5% |
| Aleuts | 0.0 /100 | #266 | Tragic 83.4% |
| Spanish Americans | 0.0 /100 | #267 | Tragic 83.4% |
| Immigrants | Lebanon | 0.0 /100 | #268 | Tragic 83.4% |
| Immigrants | Barbados | 0.0 /100 | #269 | Tragic 83.4% |
| Basques | 0.0 /100 | #270 | Tragic 83.4% |
| Hondurans | 0.0 /100 | #271 | Tragic 83.4% |
| Immigrants | Caribbean | 0.0 /100 | #272 | Tragic 83.4% |
| Immigrants | Dominica | 0.0 /100 | #273 | Tragic 83.4% |
| Marshallese | 0.0 /100 | #274 | Tragic 83.3% |
| Samoans | 0.0 /100 | #275 | Tragic 83.3% |
Demographics Similar to Immigrants from Australia by In Labor Force | Age 25-29
In terms of in labor force | age 25-29, the demographic groups most similar to Immigrants from Australia are Russian (85.3%, a difference of 0.010%), Kenyan (85.4%, a difference of 0.020%), Menominee (85.4%, a difference of 0.040%), Immigrants from Sweden (85.4%, a difference of 0.040%), and Soviet Union (85.3%, a difference of 0.050%).
| Demographics | Rating | Rank | In Labor Force | Age 25-29 |
| Immigrants | Czechoslovakia | 99.3 /100 | #65 | Exceptional 85.4% |
| Immigrants | Scotland | 99.3 /100 | #66 | Exceptional 85.4% |
| Immigrants | Turkey | 99.2 /100 | #67 | Exceptional 85.4% |
| Immigrants | Cameroon | 99.2 /100 | #68 | Exceptional 85.4% |
| Menominee | 99.1 /100 | #69 | Exceptional 85.4% |
| Immigrants | Sweden | 99.1 /100 | #70 | Exceptional 85.4% |
| Kenyans | 99.0 /100 | #71 | Exceptional 85.4% |
| Immigrants | Australia | 98.9 /100 | #72 | Exceptional 85.3% |
| Russians | 98.8 /100 | #73 | Exceptional 85.3% |
| Soviet Union | 98.5 /100 | #74 | Exceptional 85.3% |
| Brazilians | 98.3 /100 | #75 | Exceptional 85.3% |
| Germans | 98.1 /100 | #76 | Exceptional 85.3% |
| Immigrants | South Central Asia | 97.9 /100 | #77 | Exceptional 85.2% |
| Immigrants | Egypt | 97.7 /100 | #78 | Exceptional 85.2% |
| Immigrants | Northern Africa | 97.6 /100 | #79 | Exceptional 85.2% |