Croatian vs Tlingit-Haida In Labor Force | Age 25-29
COMPARE
Croatian
Tlingit-Haida
In Labor Force | Age 25-29
In Labor Force | Age 25-29 Comparison
Croatians
Tlingit-Haida
85.8%
IN LABOR FORCE | AGE 25-29
99.9/ 100
METRIC RATING
39th/ 347
METRIC RANK
84.4%
IN LABOR FORCE | AGE 25-29
19.3/ 100
METRIC RATING
197th/ 347
METRIC RANK
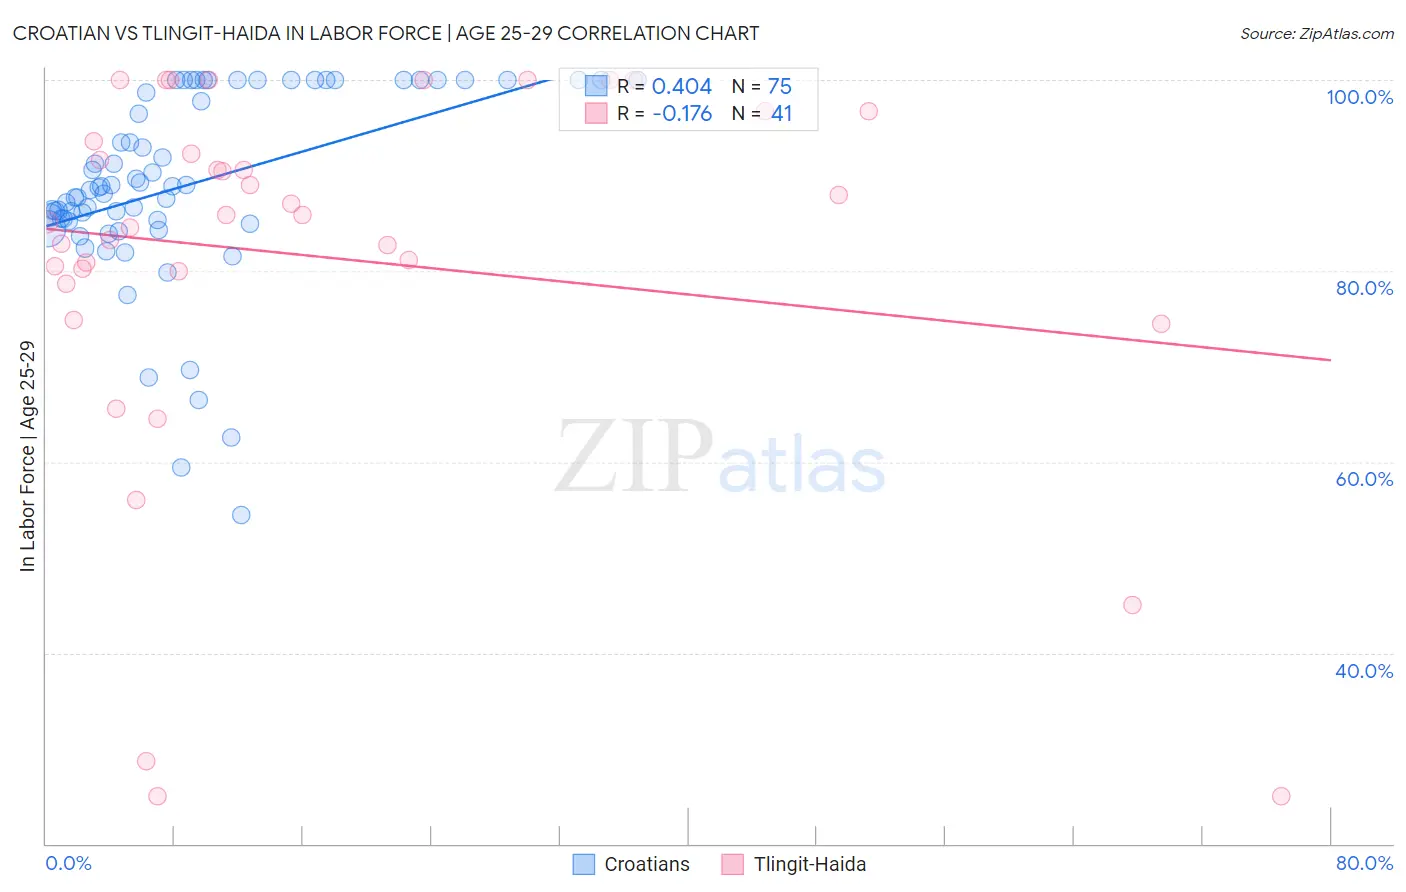
Croatian vs Tlingit-Haida In Labor Force | Age 25-29 Correlation Chart
The statistical analysis conducted on geographies consisting of 375,575,461 people shows a moderate positive correlation between the proportion of Croatians and labor force participation rate among population between the ages 25 and 29 in the United States with a correlation coefficient (R) of 0.404 and weighted average of 85.8%. Similarly, the statistical analysis conducted on geographies consisting of 60,865,267 people shows a poor negative correlation between the proportion of Tlingit-Haida and labor force participation rate among population between the ages 25 and 29 in the United States with a correlation coefficient (R) of -0.176 and weighted average of 84.4%, a difference of 1.6%.
In Labor Force | Age 25-29 Correlation Summary
| Measurement | Croatian | Tlingit-Haida |
| Minimum | 54.5% | 25.0% |
| Maximum | 100.0% | 100.0% |
| Range | 45.5% | 75.0% |
| Mean | 88.9% | 81.4% |
| Median | 88.8% | 85.8% |
| Interquartile 25% (IQ1) | 85.2% | 79.3% |
| Interquartile 75% (IQ3) | 100.0% | 95.2% |
| Interquartile Range (IQR) | 14.8% | 15.8% |
| Standard Deviation (Sample) | 10.0% | 19.9% |
| Standard Deviation (Population) | 10.0% | 19.6% |
Similar Demographics by In Labor Force | Age 25-29
Demographics Similar to Croatians by In Labor Force | Age 25-29
In terms of in labor force | age 25-29, the demographic groups most similar to Croatians are Sierra Leonean (85.8%, a difference of 0.0%), Immigrants from Albania (85.7%, a difference of 0.020%), Polish (85.8%, a difference of 0.030%), Immigrants from Greece (85.7%, a difference of 0.030%), and Immigrants from Nepal (85.8%, a difference of 0.050%).
| Demographics | Rating | Rank | In Labor Force | Age 25-29 |
| Slovaks | 100.0 /100 | #32 | Exceptional 85.8% |
| Immigrants | Bulgaria | 100.0 /100 | #33 | Exceptional 85.8% |
| Lithuanians | 99.9 /100 | #34 | Exceptional 85.8% |
| Cypriots | 99.9 /100 | #35 | Exceptional 85.8% |
| Immigrants | Nepal | 99.9 /100 | #36 | Exceptional 85.8% |
| Poles | 99.9 /100 | #37 | Exceptional 85.8% |
| Sierra Leoneans | 99.9 /100 | #38 | Exceptional 85.8% |
| Croatians | 99.9 /100 | #39 | Exceptional 85.8% |
| Immigrants | Albania | 99.9 /100 | #40 | Exceptional 85.7% |
| Immigrants | Greece | 99.9 /100 | #41 | Exceptional 85.7% |
| Immigrants | Eritrea | 99.9 /100 | #42 | Exceptional 85.7% |
| Immigrants | India | 99.9 /100 | #43 | Exceptional 85.7% |
| Macedonians | 99.9 /100 | #44 | Exceptional 85.7% |
| Immigrants | Sierra Leone | 99.9 /100 | #45 | Exceptional 85.7% |
| Czechs | 99.8 /100 | #46 | Exceptional 85.6% |
Demographics Similar to Tlingit-Haida by In Labor Force | Age 25-29
In terms of in labor force | age 25-29, the demographic groups most similar to Tlingit-Haida are Immigrants from South Eastern Asia (84.4%, a difference of 0.0%), Immigrants from Iraq (84.4%, a difference of 0.0%), Immigrants from Germany (84.4%, a difference of 0.010%), Portuguese (84.4%, a difference of 0.020%), and Immigrants from Israel (84.4%, a difference of 0.020%).
| Demographics | Rating | Rank | In Labor Force | Age 25-29 |
| Welsh | 31.1 /100 | #190 | Fair 84.5% |
| Zimbabweans | 28.7 /100 | #191 | Fair 84.5% |
| English | 25.8 /100 | #192 | Fair 84.5% |
| South American Indians | 25.0 /100 | #193 | Fair 84.5% |
| Portuguese | 21.2 /100 | #194 | Fair 84.4% |
| Immigrants | Israel | 20.8 /100 | #195 | Fair 84.4% |
| Immigrants | South Eastern Asia | 19.5 /100 | #196 | Poor 84.4% |
| Tlingit-Haida | 19.3 /100 | #197 | Poor 84.4% |
| Immigrants | Iraq | 19.0 /100 | #198 | Poor 84.4% |
| Immigrants | Germany | 18.3 /100 | #199 | Poor 84.4% |
| Immigrants | Kazakhstan | 17.5 /100 | #200 | Poor 84.4% |
| Laotians | 16.6 /100 | #201 | Poor 84.4% |
| Afghans | 15.9 /100 | #202 | Poor 84.4% |
| Immigrants | Afghanistan | 15.6 /100 | #203 | Poor 84.4% |
| Venezuelans | 15.1 /100 | #204 | Poor 84.4% |