Albanian vs Tlingit-Haida In Labor Force | Age 25-29
COMPARE
Albanian
Tlingit-Haida
In Labor Force | Age 25-29
In Labor Force | Age 25-29 Comparison
Albanians
Tlingit-Haida
85.5%
IN LABOR FORCE | AGE 25-29
99.7/ 100
METRIC RATING
54th/ 347
METRIC RANK
84.4%
IN LABOR FORCE | AGE 25-29
19.3/ 100
METRIC RATING
197th/ 347
METRIC RANK
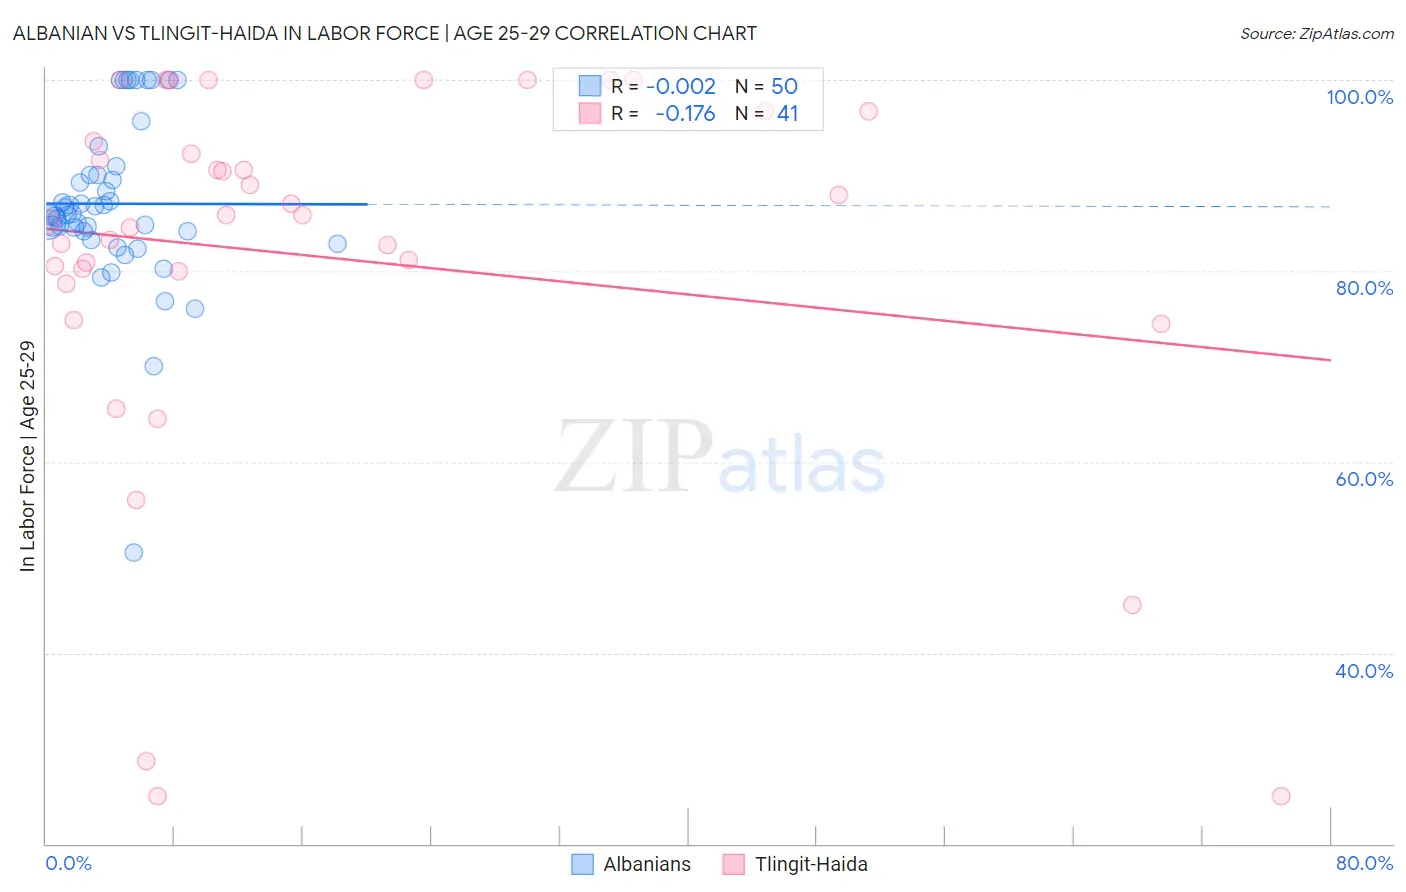
Albanian vs Tlingit-Haida In Labor Force | Age 25-29 Correlation Chart
The statistical analysis conducted on geographies consisting of 193,233,766 people shows no correlation between the proportion of Albanians and labor force participation rate among population between the ages 25 and 29 in the United States with a correlation coefficient (R) of -0.002 and weighted average of 85.5%. Similarly, the statistical analysis conducted on geographies consisting of 60,865,267 people shows a poor negative correlation between the proportion of Tlingit-Haida and labor force participation rate among population between the ages 25 and 29 in the United States with a correlation coefficient (R) of -0.176 and weighted average of 84.4%, a difference of 1.3%.
In Labor Force | Age 25-29 Correlation Summary
| Measurement | Albanian | Tlingit-Haida |
| Minimum | 50.5% | 25.0% |
| Maximum | 100.0% | 100.0% |
| Range | 49.5% | 75.0% |
| Mean | 87.0% | 81.4% |
| Median | 85.9% | 85.8% |
| Interquartile 25% (IQ1) | 84.2% | 79.3% |
| Interquartile 75% (IQ3) | 90.1% | 95.2% |
| Interquartile Range (IQR) | 5.9% | 15.8% |
| Standard Deviation (Sample) | 8.9% | 19.9% |
| Standard Deviation (Population) | 8.8% | 19.6% |
Similar Demographics by In Labor Force | Age 25-29
Demographics Similar to Albanians by In Labor Force | Age 25-29
In terms of in labor force | age 25-29, the demographic groups most similar to Albanians are Belgian (85.5%, a difference of 0.0%), Immigrants from Brazil (85.5%, a difference of 0.010%), Immigrants from Poland (85.6%, a difference of 0.030%), Eastern European (85.5%, a difference of 0.040%), and Yugoslavian (85.6%, a difference of 0.050%).
| Demographics | Rating | Rank | In Labor Force | Age 25-29 |
| Turks | 99.8 /100 | #47 | Exceptional 85.6% |
| Italians | 99.8 /100 | #48 | Exceptional 85.6% |
| Swedes | 99.8 /100 | #49 | Exceptional 85.6% |
| Yugoslavians | 99.8 /100 | #50 | Exceptional 85.6% |
| Immigrants | Latvia | 99.8 /100 | #51 | Exceptional 85.6% |
| Immigrants | Poland | 99.7 /100 | #52 | Exceptional 85.6% |
| Belgians | 99.7 /100 | #53 | Exceptional 85.5% |
| Albanians | 99.7 /100 | #54 | Exceptional 85.5% |
| Immigrants | Brazil | 99.7 /100 | #55 | Exceptional 85.5% |
| Eastern Europeans | 99.6 /100 | #56 | Exceptional 85.5% |
| Estonians | 99.6 /100 | #57 | Exceptional 85.5% |
| Greeks | 99.6 /100 | #58 | Exceptional 85.5% |
| Immigrants | Morocco | 99.5 /100 | #59 | Exceptional 85.5% |
| Thais | 99.5 /100 | #60 | Exceptional 85.5% |
| Serbians | 99.5 /100 | #61 | Exceptional 85.5% |
Demographics Similar to Tlingit-Haida by In Labor Force | Age 25-29
In terms of in labor force | age 25-29, the demographic groups most similar to Tlingit-Haida are Immigrants from South Eastern Asia (84.4%, a difference of 0.0%), Immigrants from Iraq (84.4%, a difference of 0.0%), Immigrants from Germany (84.4%, a difference of 0.010%), Portuguese (84.4%, a difference of 0.020%), and Immigrants from Israel (84.4%, a difference of 0.020%).
| Demographics | Rating | Rank | In Labor Force | Age 25-29 |
| Welsh | 31.1 /100 | #190 | Fair 84.5% |
| Zimbabweans | 28.7 /100 | #191 | Fair 84.5% |
| English | 25.8 /100 | #192 | Fair 84.5% |
| South American Indians | 25.0 /100 | #193 | Fair 84.5% |
| Portuguese | 21.2 /100 | #194 | Fair 84.4% |
| Immigrants | Israel | 20.8 /100 | #195 | Fair 84.4% |
| Immigrants | South Eastern Asia | 19.5 /100 | #196 | Poor 84.4% |
| Tlingit-Haida | 19.3 /100 | #197 | Poor 84.4% |
| Immigrants | Iraq | 19.0 /100 | #198 | Poor 84.4% |
| Immigrants | Germany | 18.3 /100 | #199 | Poor 84.4% |
| Immigrants | Kazakhstan | 17.5 /100 | #200 | Poor 84.4% |
| Laotians | 16.6 /100 | #201 | Poor 84.4% |
| Afghans | 15.9 /100 | #202 | Poor 84.4% |
| Immigrants | Afghanistan | 15.6 /100 | #203 | Poor 84.4% |
| Venezuelans | 15.1 /100 | #204 | Poor 84.4% |