Immigrants from Nigeria vs Tlingit-Haida In Labor Force | Age 25-29
COMPARE
Immigrants from Nigeria
Tlingit-Haida
In Labor Force | Age 25-29
In Labor Force | Age 25-29 Comparison
Immigrants from Nigeria
Tlingit-Haida
84.3%
IN LABOR FORCE | AGE 25-29
9.0/ 100
METRIC RATING
218th/ 347
METRIC RANK
84.4%
IN LABOR FORCE | AGE 25-29
19.3/ 100
METRIC RATING
197th/ 347
METRIC RANK
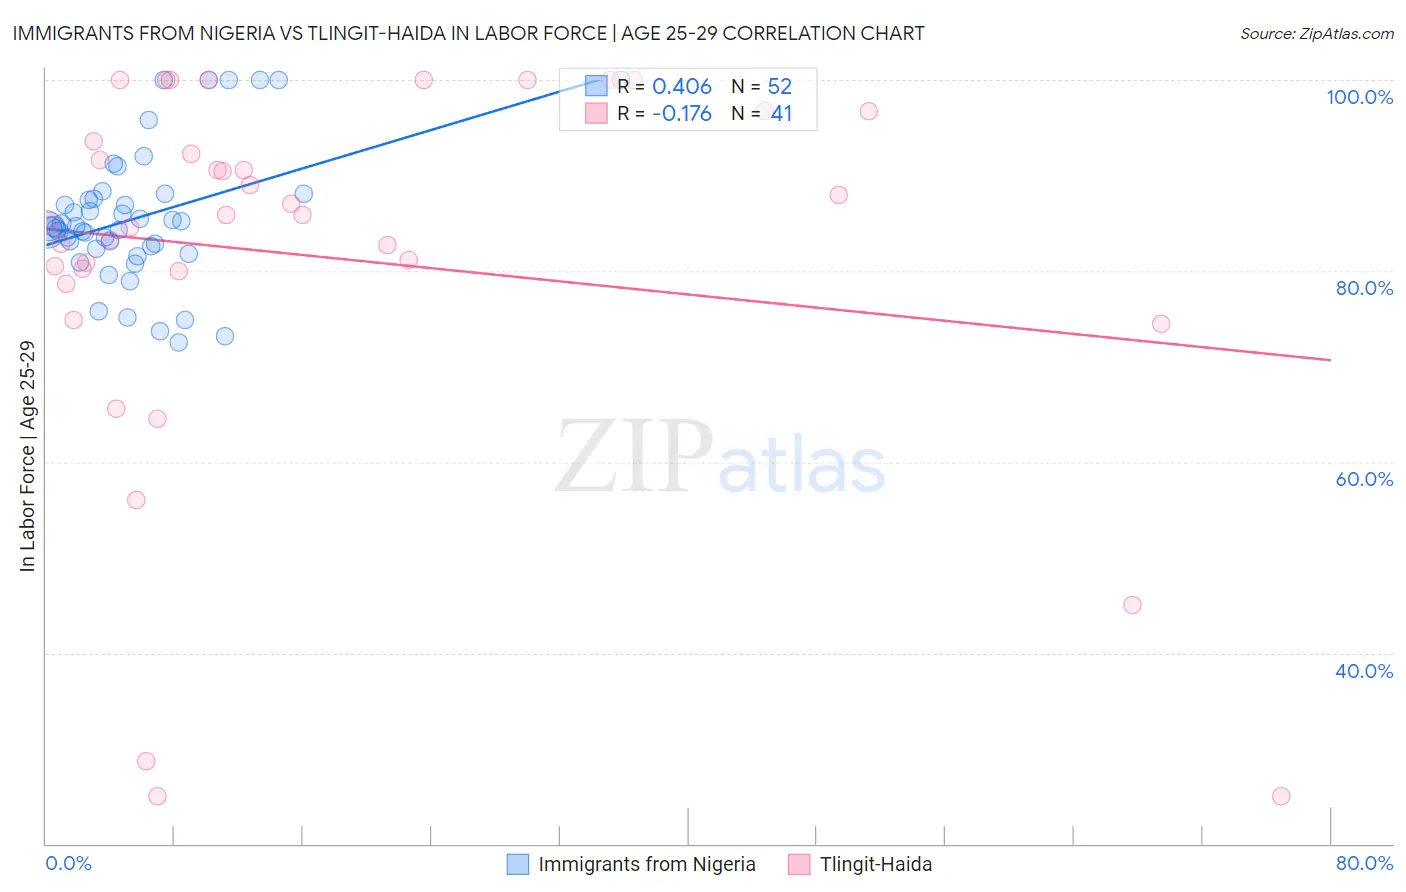
Immigrants from Nigeria vs Tlingit-Haida In Labor Force | Age 25-29 Correlation Chart
The statistical analysis conducted on geographies consisting of 283,439,551 people shows a moderate positive correlation between the proportion of Immigrants from Nigeria and labor force participation rate among population between the ages 25 and 29 in the United States with a correlation coefficient (R) of 0.406 and weighted average of 84.3%. Similarly, the statistical analysis conducted on geographies consisting of 60,865,267 people shows a poor negative correlation between the proportion of Tlingit-Haida and labor force participation rate among population between the ages 25 and 29 in the United States with a correlation coefficient (R) of -0.176 and weighted average of 84.4%, a difference of 0.16%.
In Labor Force | Age 25-29 Correlation Summary
| Measurement | Immigrants from Nigeria | Tlingit-Haida |
| Minimum | 72.5% | 25.0% |
| Maximum | 100.0% | 100.0% |
| Range | 27.5% | 75.0% |
| Mean | 85.6% | 81.4% |
| Median | 84.5% | 85.8% |
| Interquartile 25% (IQ1) | 82.4% | 79.3% |
| Interquartile 75% (IQ3) | 87.8% | 95.2% |
| Interquartile Range (IQR) | 5.4% | 15.8% |
| Standard Deviation (Sample) | 7.0% | 19.9% |
| Standard Deviation (Population) | 6.9% | 19.6% |
Similar Demographics by In Labor Force | Age 25-29
Demographics Similar to Immigrants from Nigeria by In Labor Force | Age 25-29
In terms of in labor force | age 25-29, the demographic groups most similar to Immigrants from Nigeria are Immigrants from Saudi Arabia (84.3%, a difference of 0.0%), Israeli (84.3%, a difference of 0.010%), Immigrants from Ecuador (84.3%, a difference of 0.010%), Lebanese (84.3%, a difference of 0.040%), and Immigrants from Syria (84.3%, a difference of 0.040%).
| Demographics | Rating | Rank | In Labor Force | Age 25-29 |
| Immigrants | Venezuela | 12.6 /100 | #211 | Poor 84.3% |
| Sub-Saharan Africans | 11.7 /100 | #212 | Poor 84.3% |
| Japanese | 11.4 /100 | #213 | Poor 84.3% |
| Lebanese | 11.1 /100 | #214 | Poor 84.3% |
| Immigrants | Syria | 10.7 /100 | #215 | Poor 84.3% |
| Israelis | 9.3 /100 | #216 | Tragic 84.3% |
| Immigrants | Ecuador | 9.3 /100 | #217 | Tragic 84.3% |
| Immigrants | Nigeria | 9.0 /100 | #218 | Tragic 84.3% |
| Immigrants | Saudi Arabia | 8.8 /100 | #219 | Tragic 84.3% |
| Nigerians | 7.2 /100 | #220 | Tragic 84.3% |
| Arabs | 6.8 /100 | #221 | Tragic 84.2% |
| Jordanians | 6.7 /100 | #222 | Tragic 84.2% |
| Scotch-Irish | 6.5 /100 | #223 | Tragic 84.2% |
| Immigrants | West Indies | 6.0 /100 | #224 | Tragic 84.2% |
| Koreans | 5.9 /100 | #225 | Tragic 84.2% |
Demographics Similar to Tlingit-Haida by In Labor Force | Age 25-29
In terms of in labor force | age 25-29, the demographic groups most similar to Tlingit-Haida are Immigrants from South Eastern Asia (84.4%, a difference of 0.0%), Immigrants from Iraq (84.4%, a difference of 0.0%), Immigrants from Germany (84.4%, a difference of 0.010%), Portuguese (84.4%, a difference of 0.020%), and Immigrants from Israel (84.4%, a difference of 0.020%).
| Demographics | Rating | Rank | In Labor Force | Age 25-29 |
| Welsh | 31.1 /100 | #190 | Fair 84.5% |
| Zimbabweans | 28.7 /100 | #191 | Fair 84.5% |
| English | 25.8 /100 | #192 | Fair 84.5% |
| South American Indians | 25.0 /100 | #193 | Fair 84.5% |
| Portuguese | 21.2 /100 | #194 | Fair 84.4% |
| Immigrants | Israel | 20.8 /100 | #195 | Fair 84.4% |
| Immigrants | South Eastern Asia | 19.5 /100 | #196 | Poor 84.4% |
| Tlingit-Haida | 19.3 /100 | #197 | Poor 84.4% |
| Immigrants | Iraq | 19.0 /100 | #198 | Poor 84.4% |
| Immigrants | Germany | 18.3 /100 | #199 | Poor 84.4% |
| Immigrants | Kazakhstan | 17.5 /100 | #200 | Poor 84.4% |
| Laotians | 16.6 /100 | #201 | Poor 84.4% |
| Afghans | 15.9 /100 | #202 | Poor 84.4% |
| Immigrants | Afghanistan | 15.6 /100 | #203 | Poor 84.4% |
| Venezuelans | 15.1 /100 | #204 | Poor 84.4% |