Immigrants from Korea vs Zimbabwean In Labor Force | Age 35-44
COMPARE
Immigrants from Korea
Zimbabwean
In Labor Force | Age 35-44
In Labor Force | Age 35-44 Comparison
Immigrants from Korea
Zimbabweans
84.6%
IN LABOR FORCE | AGE 35-44
88.2/ 100
METRIC RATING
134th/ 347
METRIC RANK
86.1%
IN LABOR FORCE | AGE 35-44
100.0/ 100
METRIC RATING
5th/ 347
METRIC RANK
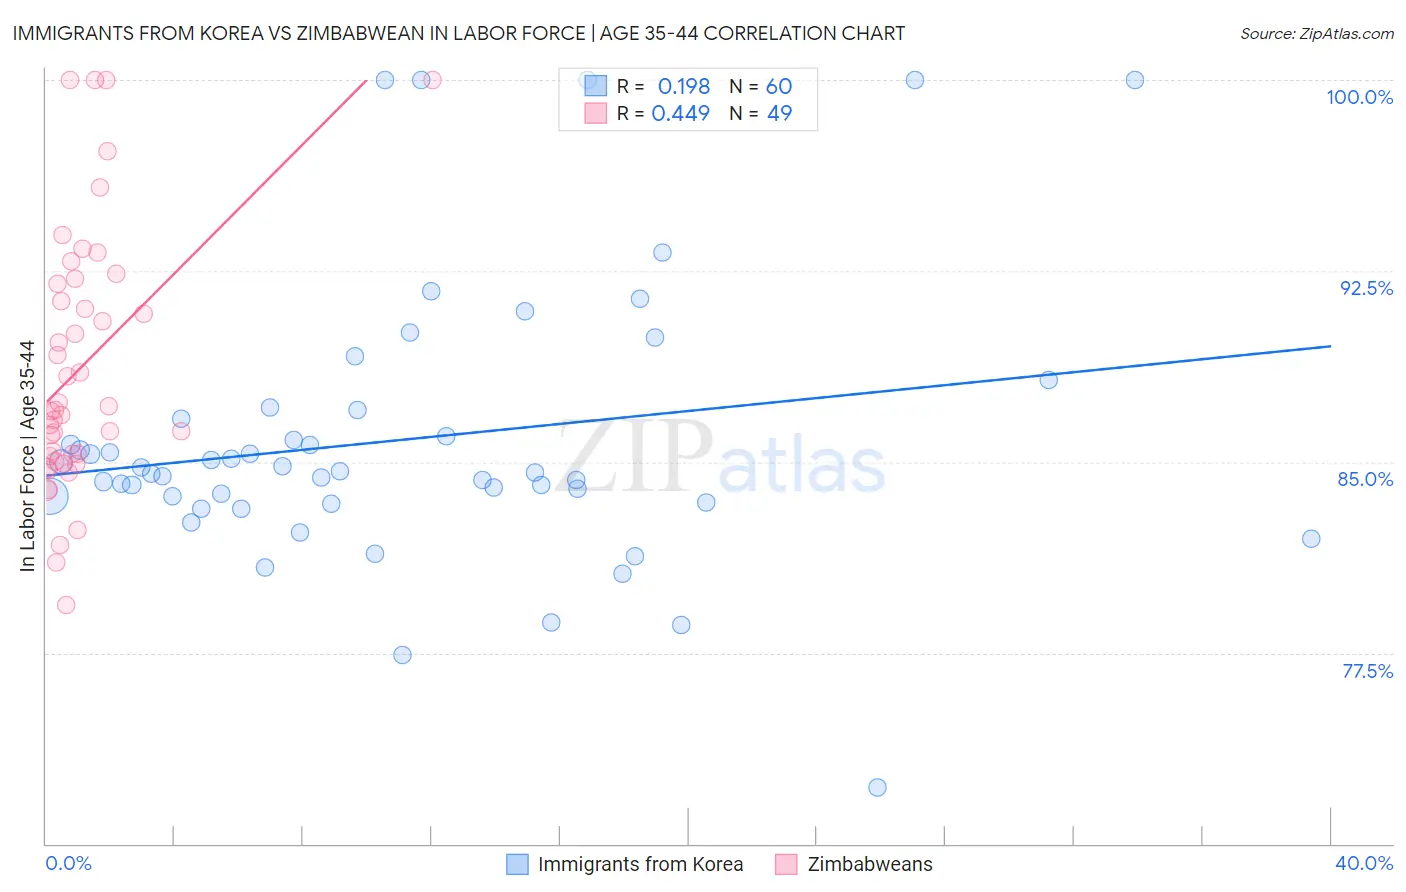
Immigrants from Korea vs Zimbabwean In Labor Force | Age 35-44 Correlation Chart
The statistical analysis conducted on geographies consisting of 416,059,040 people shows a poor positive correlation between the proportion of Immigrants from Korea and labor force participation rate among population between the ages 35 and 44 in the United States with a correlation coefficient (R) of 0.198 and weighted average of 84.6%. Similarly, the statistical analysis conducted on geographies consisting of 69,188,231 people shows a moderate positive correlation between the proportion of Zimbabweans and labor force participation rate among population between the ages 35 and 44 in the United States with a correlation coefficient (R) of 0.449 and weighted average of 86.1%, a difference of 1.7%.
In Labor Force | Age 35-44 Correlation Summary
| Measurement | Immigrants from Korea | Zimbabwean |
| Minimum | 72.2% | 79.4% |
| Maximum | 100.0% | 100.0% |
| Range | 27.8% | 20.6% |
| Mean | 85.9% | 88.7% |
| Median | 84.6% | 87.0% |
| Interquartile 25% (IQ1) | 83.5% | 85.1% |
| Interquartile 75% (IQ3) | 86.9% | 92.1% |
| Interquartile Range (IQR) | 3.3% | 7.0% |
| Standard Deviation (Sample) | 5.5% | 5.1% |
| Standard Deviation (Population) | 5.4% | 5.0% |
Similar Demographics by In Labor Force | Age 35-44
Demographics Similar to Immigrants from Korea by In Labor Force | Age 35-44
In terms of in labor force | age 35-44, the demographic groups most similar to Immigrants from Korea are Argentinean (84.6%, a difference of 0.0%), Immigrants from Malaysia (84.6%, a difference of 0.010%), Palestinian (84.7%, a difference of 0.020%), Bhutanese (84.7%, a difference of 0.020%), and Immigrants from Scotland (84.7%, a difference of 0.020%).
| Demographics | Rating | Rank | In Labor Force | Age 35-44 |
| Immigrants | Spain | 90.6 /100 | #127 | Exceptional 84.7% |
| Immigrants | Ghana | 90.4 /100 | #128 | Exceptional 84.7% |
| Palestinians | 89.7 /100 | #129 | Excellent 84.7% |
| Bhutanese | 89.7 /100 | #130 | Excellent 84.7% |
| Immigrants | Scotland | 89.6 /100 | #131 | Excellent 84.7% |
| Austrians | 89.4 /100 | #132 | Excellent 84.7% |
| Argentineans | 88.4 /100 | #133 | Excellent 84.6% |
| Immigrants | Korea | 88.2 /100 | #134 | Excellent 84.6% |
| Immigrants | Malaysia | 87.5 /100 | #135 | Excellent 84.6% |
| Afghans | 86.3 /100 | #136 | Excellent 84.6% |
| Immigrants | Chile | 84.6 /100 | #137 | Excellent 84.6% |
| Czechoslovakians | 82.6 /100 | #138 | Excellent 84.6% |
| Immigrants | Zaire | 82.5 /100 | #139 | Excellent 84.6% |
| Immigrants | Japan | 81.4 /100 | #140 | Excellent 84.6% |
| Immigrants | Belgium | 80.8 /100 | #141 | Excellent 84.6% |
Demographics Similar to Zimbabweans by In Labor Force | Age 35-44
In terms of in labor force | age 35-44, the demographic groups most similar to Zimbabweans are Bolivian (86.1%, a difference of 0.010%), Immigrants from Sierra Leone (86.1%, a difference of 0.050%), Immigrants from Cabo Verde (86.2%, a difference of 0.13%), Immigrants from Bolivia (86.2%, a difference of 0.16%), and Immigrants from Ethiopia (85.9%, a difference of 0.22%).
| Demographics | Rating | Rank | In Labor Force | Age 35-44 |
| Sierra Leoneans | 100.0 /100 | #1 | Exceptional 86.4% |
| Luxembourgers | 100.0 /100 | #2 | Exceptional 86.4% |
| Immigrants | Bolivia | 100.0 /100 | #3 | Exceptional 86.2% |
| Immigrants | Cabo Verde | 100.0 /100 | #4 | Exceptional 86.2% |
| Zimbabweans | 100.0 /100 | #5 | Exceptional 86.1% |
| Bolivians | 100.0 /100 | #6 | Exceptional 86.1% |
| Immigrants | Sierra Leone | 100.0 /100 | #7 | Exceptional 86.1% |
| Immigrants | Ethiopia | 100.0 /100 | #8 | Exceptional 85.9% |
| Ethiopians | 100.0 /100 | #9 | Exceptional 85.9% |
| Cape Verdeans | 100.0 /100 | #10 | Exceptional 85.8% |
| Immigrants | Cameroon | 100.0 /100 | #11 | Exceptional 85.8% |
| Liberians | 100.0 /100 | #12 | Exceptional 85.7% |
| Somalis | 100.0 /100 | #13 | Exceptional 85.6% |
| Immigrants | Somalia | 100.0 /100 | #14 | Exceptional 85.6% |
| Norwegians | 100.0 /100 | #15 | Exceptional 85.6% |